Fig. 6
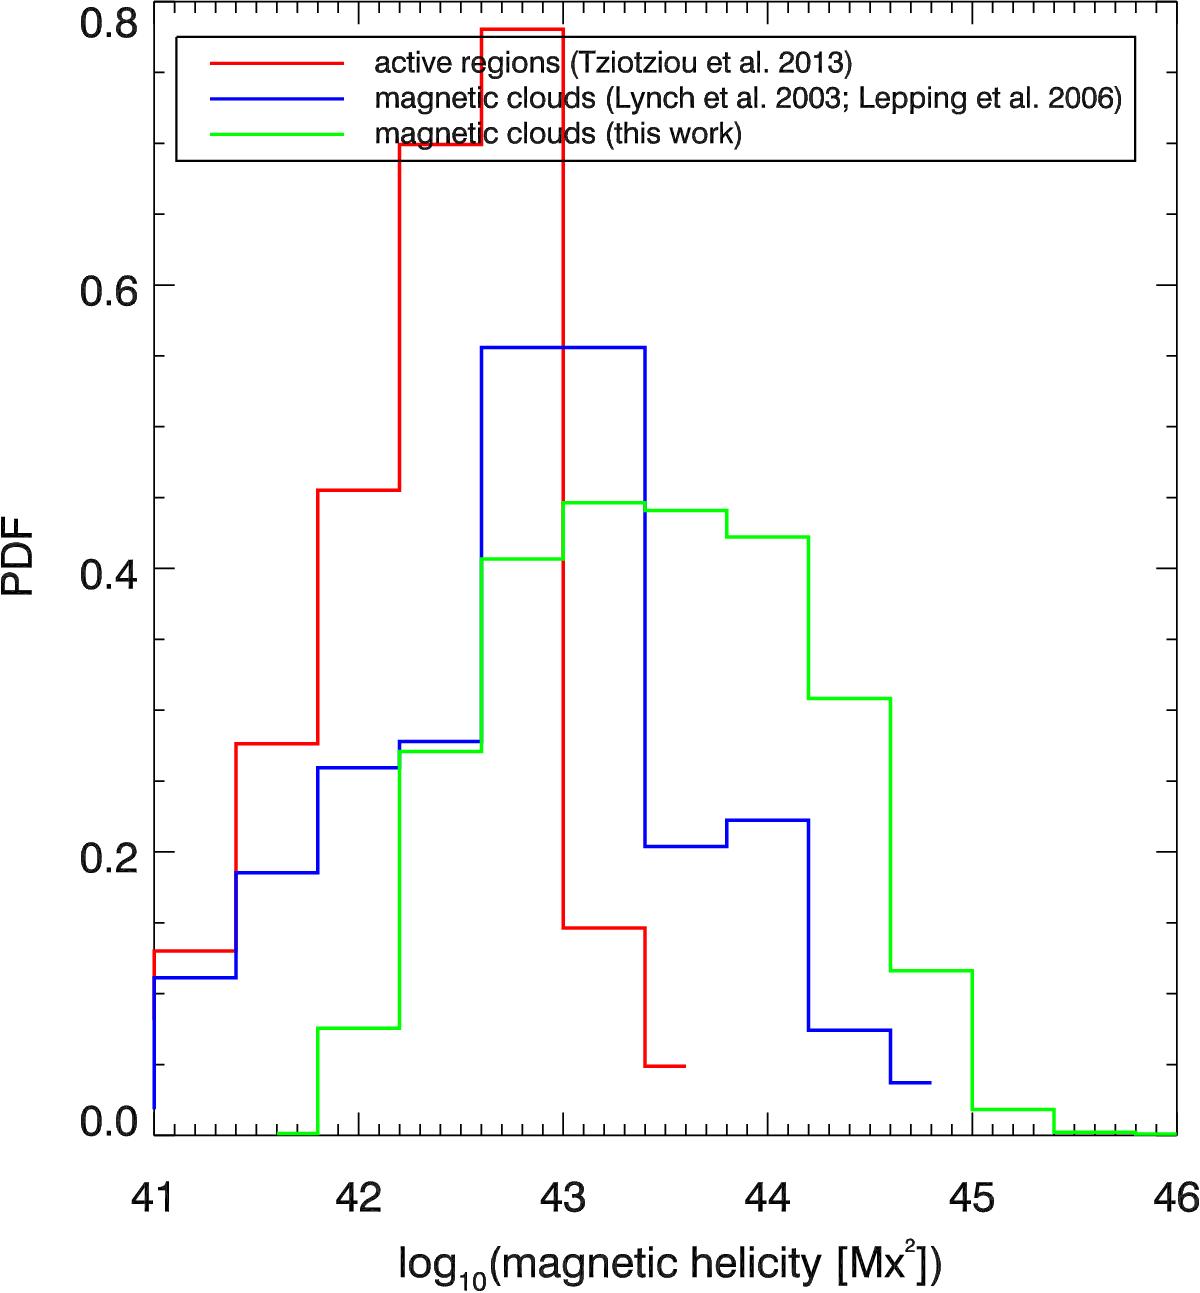
Probability density functions of the Hm corresponding to (a) AR sample of Tziotziou et al. (2013; red histogram), (b) MC linear-force free fittings at 1 AU using the data from the Lynch et al. (2003) and Lepping et al. (2006) studies (blue histogram), and (c) B1 AU corresponding to the best-fit αB from this work (green histogram).
Current usage metrics show cumulative count of Article Views (full-text article views including HTML views, PDF and ePub downloads, according to the available data) and Abstracts Views on Vision4Press platform.
Data correspond to usage on the plateform after 2015. The current usage metrics is available 48-96 hours after online publication and is updated daily on week days.
Initial download of the metrics may take a while.