Free Access
Fig. 5
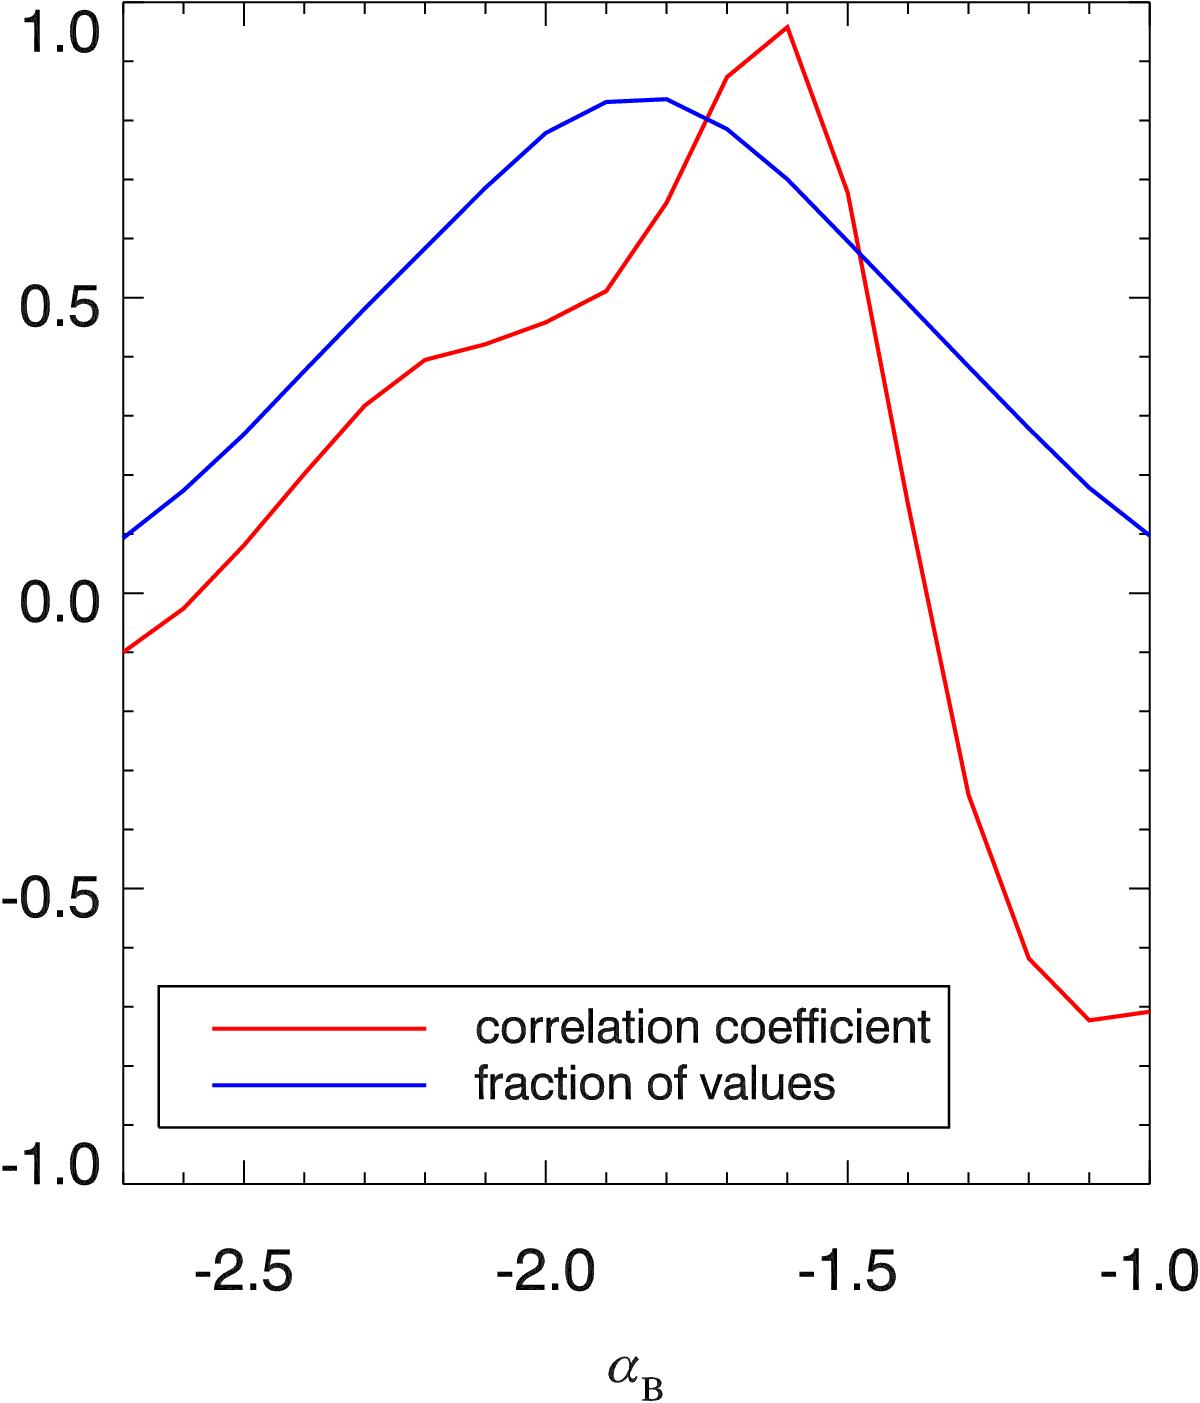
Correlation coefficient of the probability density functions for the predicted B1 AU and observed BMC values at L1 as a function of αB (red curve). Also shown is the respective fraction of B1 AU values (blue curve) falling within the observed BMC range.
Current usage metrics show cumulative count of Article Views (full-text article views including HTML views, PDF and ePub downloads, according to the available data) and Abstracts Views on Vision4Press platform.
Data correspond to usage on the plateform after 2015. The current usage metrics is available 48-96 hours after online publication and is updated daily on week days.
Initial download of the metrics may take a while.