Fig. 4
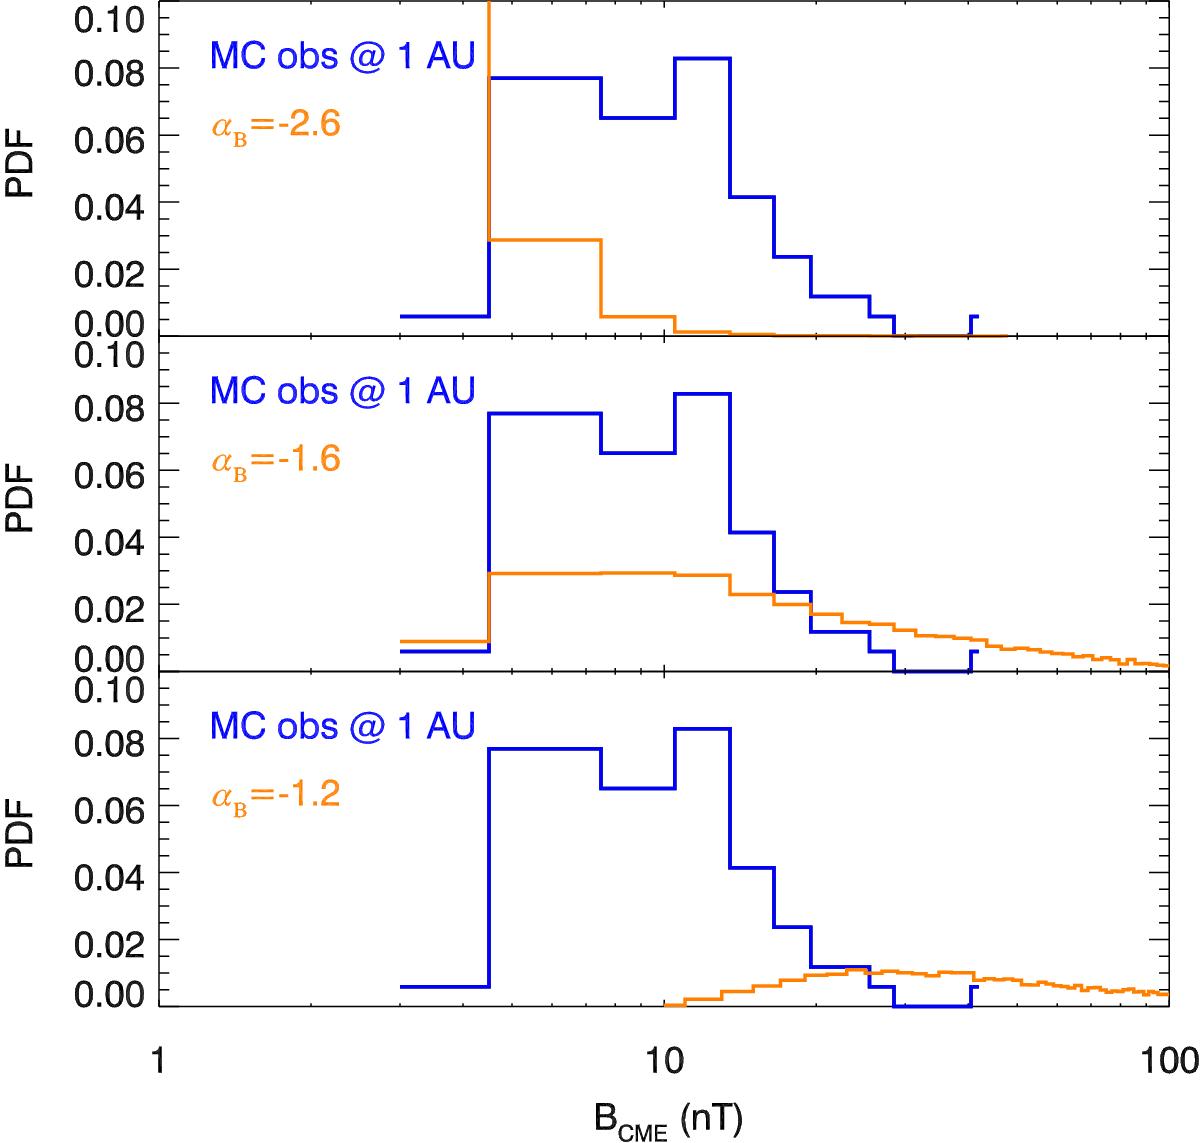
Probability density functions of the extrapolated to 1 AU magnetic field for 10 000 synthetic CMEs (orange histogram). The probability density functions correspond to αB equal to − 2.6 (top plot), − 1.6 (middle plot), and − 1.2 (bottom plot). All cases are compared with the PDF of the magnetic field magnitude for 162 magnetic observed in situ at L1 by WIND (blue histogram).
Current usage metrics show cumulative count of Article Views (full-text article views including HTML views, PDF and ePub downloads, according to the available data) and Abstracts Views on Vision4Press platform.
Data correspond to usage on the plateform after 2015. The current usage metrics is available 48-96 hours after online publication and is updated daily on week days.
Initial download of the metrics may take a while.