Free Access
Fig. 2
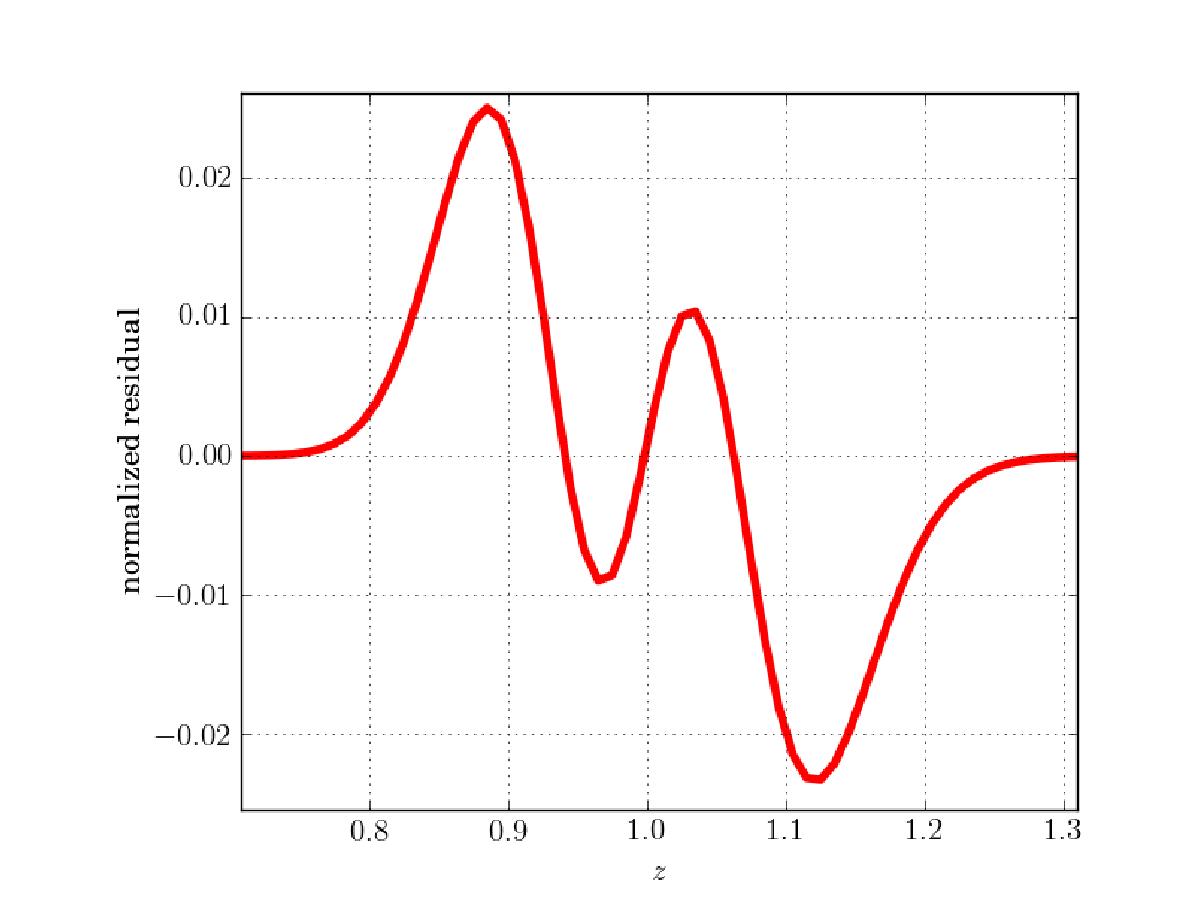
Graphical comparison between Pg(z) as in Eq. (2) and its Gaussian approximation ![]() , where zp,g = 1 is chosen equal to the median redshift of the halos in the sample. Normalized residuals
, where zp,g = 1 is chosen equal to the median redshift of the halos in the sample. Normalized residuals ![]() are plotted as a function of z. By construction the integral of the function is null.
are plotted as a function of z. By construction the integral of the function is null.
Current usage metrics show cumulative count of Article Views (full-text article views including HTML views, PDF and ePub downloads, according to the available data) and Abstracts Views on Vision4Press platform.
Data correspond to usage on the plateform after 2015. The current usage metrics is available 48-96 hours after online publication and is updated daily on week days.
Initial download of the metrics may take a while.