| Issue |
A&A
Volume 595, November 2016
|
|
|---|---|---|
| Article Number | A21 | |
| Number of page(s) | 14 | |
| Section | Cosmology (including clusters of galaxies) | |
| DOI | https://doi.org/10.1051/0004-6361/201424904 | |
| Published online | 24 October 2016 | |
Probing the physics and history of cosmic reionization with the Sunyaev-Zel’dovich effect
1 INAF–Osservatorio Astronomico di Roma via Frascati 33, 00040 Monteporzio, Italy
e-mail: This email address is being protected from spambots. You need JavaScript enabled to view it.
2 School of Physics, University of the Witwatersrand, Private Bag 3, 2050 - Johannesburg, South Africa
e-mail: This email address is being protected from spambots. You need JavaScript enabled to view it.
Received: 2 September 2014
Accepted: 18 July 2016
Abstract
Context. The evolution of the Universe during the dark ages (DA) and the epoch of reonization (EoR) marks an important transition in the history of the Universe but it is not yet fully understood.
Aims. We study here an alternative technique to probe the DA and EoR that makes use of the Comptonization of the CMB spectrum modified by physical effects occurring during this epoch related to the emergence of the 21-cm radiation background. Inverse Compton scattering of 21-cm photon background by thermal and non-thermal electrons residing in the atmospheres of cosmic structures like galaxy clusters, radiogalaxy lobes and galaxy halos, produces a specific form of Sunyaev-Zel’dovich effect (SZE) that we refer to as SZE-21 cm.
Methods. We derived the SZE-21 cm in a general relativistic approach, which is required to describe the correct spectral features of this astrophysical effect. We calculated the spectral features of the thermal and non-thermal SZE-21 cm in galaxy clusters and in radiogalaxy lobes, and their dependence on the history of physical mechanisms occurring during the DA and EoR. We studied how the spectral shape of the SZE-21 cm can be used to establish the global features in the mean 21-cm spectrum generated during and prior to the EoR, and how it depends on the properties of the (thermal and non-thermal) plasma in cosmic structures.
Results. We found that the thermal and non-thermal SZE-21 cm have peculiar spectral shapes that allow to investigate the physics and history of the EoR and DA. Its spectrum depends on the gas temperature (for the thermal SZE-21 cm) and on the electrons minimum momentum (for the non-thermal SZE-21 cm). The global SZE-21 cm signal can be detected (in ~ 1000 h) by SKA1-low in the frequency range ν ≳ 75−90 MHz, for clusters in the temperature range 5 to 20 keV, and the difference between the SZE-21 cm and the standard SZE can be detected by SKA1 or SKA2 at frequencies depending on the background model and the cluster temperature.
Conclusions. We have shown that the detection of the SZE-21 cm can provide unique information on the DA and EoR, and on the cosmic structures that produce the scattering; the frequencies at which the SZE-21 cm shows its main spectral features will indicate the epoch at which the physical processes related to the cosmological 21-cm signal occurred and shed light on the cosmic history during the DA and EoR by using local, well-known cosmic structures like galaxy clusters and radio galaxies.
Key words: dark ages, reionization, first stars / galaxies: clusters: general / cosmic background radiation
© ESO, 2016
1. Introduction
Departures of the cosmic microwave background (CMB) frequency spectrum from a pure blackbody encode information about the thermal history of the early Universe before the epoch of recombination when it emerged from the last scattering surface. The evolution of the Universe after this epoch proceeds through the period of the dark ages (DA) that ends ~ 400 million years later, when the first galaxies formed and started emitting ionizing radiation.
The transition period at the end of the DA marks the epoch of reionization (EoR). During this epoch, radiation from the very first luminous sources (e.g., early stars, galaxies, and quasars) succeeded in ionizing the neutral hydrogen gas that had filled the Universe since the recombination event (see, e.g., Barkana & Loeb 2001; Loeb & Barkana 2001; Bromm & Larson 2004; Ciardi & Ferrara 2005; Choudhury & Ferrara 2006; Furlanetto et al. 2006; Morales & Wyithe 2010). The current constraints suggest that the EoR roughly occurs within the redshift range of z ≈ 6−20. This cosmic period is not yet completely understood and various astrophysical probes have been suggested to shed light on this epoch for early structure formation (see Zaroubi 2013 for a review).
Information from the DA period is not explicitly contained in the CMB because baryonic matter and radiation have already decoupled, and the bulk of baryonic matter in the Universe during this period is in the form of neutral hydrogen gas in the inter galactic medium (IGM). Rather than target observations at the first galaxies and quasars that are the rare, early products of gravitational collapse, it is then necessary to detect directly the presence of the ubiquitous hydrogen gas. One of the methods of achieving this detection is to search for signatures of the (highly redshifted) 21-cm hyperfine transition line of neutral hydrogen (see, e.g., Loeb & Zaldarriaga 2004; Cooray 2004; Bharadwaj & Ali 2004; Carilli et al. 2004; Furlanetto & Briggs 2004; Furlanetto et al. 2006; Pritchard & Loeb 2010, 2012; Liu et al. 2013). The 21-cm signal from the DA would appear as a faint, diffuse background detectable at frequencies below 200 MHz (for redshifts z> 6). Thus, measuring the brightness temperature of the redshifted 21-cm background could yield information about both the global and local properties of the IGM. Determining the average brightness temperature over a large solid angle as a function of redshift would eliminate any dependence on local density perturbations and constrain the history of the neutral fraction of hydrogen in the IGM.
It has been noted that there are several problems related to the observation of the 21-cm background. Firstly, this signal is faint, of the order of tens of mK relative to the CMB (see, e.g., Furlanetto et al. 2006), and until now only upper limits have been obtained (see, e.g., Paciga et al. 2013; Dillon et al. 2014; Parsons et al. 2014). The second problem is related to the presence of galactic and extragalactic foregrounds whose amplitude can be also about four order of magnitude larger than this signal (see, e.g., de Oliveira-Costa et al. 2008). These problems make it difficult to study this signal with the present-day and new generation of radio interferometers, since they are not sensitive to the mean signal, but only to its inhomogeneity, and thus require a very precise calibration and knowledge of foregrounds to remove their contribution (see, e.g., discussion in Furlanetto et al. 2006).
Various methods have been proposed to overcome these problems. One possibility is studying the 21-cm fluctuations to measure the mean background through their redshift-space anisotropies (Barkana & Loeb 2005a); this method can be used with the next-generation instruments like the Square Kilometer Array (SKA) (see, e.g., McQuinn et al. 2006). A second method is to measure the contrast between the 21-cm signal and the bubbles of ionized plasma present during the EoR, and use their contrast to measure the mean amount of neutral gas (see, e.g., Furlanetto et al. 2006, and references therein).
An alternative method that we want to discuss extensively in this paper is to use the Sunyaev-Zel’dovich effect (hereafter SZE-21 cm), that is the spectral distortion of the CMB spectrum modified by physical effects occurring during the epoch related to the emergence of the 21-cm radiation background, induced by inverse Compton scattering off the intervening electrons in the atmospheres of various cosmic structures, like galaxy clusters, radiogalaxy lobes and galactic halos.
A preliminary attempt to calculate the SZE-21 cm has been presented by Cooray (2006). This calculation turns out to be inadequate in producing a correct description of the SZE-21 cm for two reasons:
-
i)
the photon background model used for the modification to theCMB caused by mechanisms working during the DA and EoR isunphysical, because it contains a number of artificialdiscontinuities, under-resolves the main features of interest at ν ~ 70 MHz and contains an unphysical reionization history that produces substantial 21-cm signal down to redshifts z < 2 (i.e., at frequencies > 300 MHz);
-
ii)
it is performed in the non-relativistic approximation of the Compton scattering process of CMB photons in the hot intra-cluster medium of galaxy clusters thus neglecting any effect induced by the relativistic corrections to this scattering, by multiple scattering effects and by the scattering of additional non-thermal electrons in clusters, as explicitly reported by Cooray (2006).
Such problems in the Cooray (2006) calculations lead to an incorrect description of the SZE-21 cm that has important consequences in using this cosmological probe. In fact, to take full advantage of the SZE-21 cm study, it is necessary to use a full relativistic formalism, its generalization to any order of magnitude in the plasma optical depth τ and the possibility to include also the combination of various electron populations residing in cosmic structures (see, e.g., Colafrancesco et al. 2003). It is also necessary to use a wider and more physically motivated set of models for the 21-cm background, including also other physical processes that can change this background, such as the effect of dark matter (DM) heating. Finally, it is worth considering the effect of changing the redshifts at which the different physical processes took place. In this paper we perform such a more complete study following the previous lines of investigation.
First, to describe the CMB spectrum modified by the 21-cm cosmological background, we used the results of the 21 cmFAST code (Mesinger et al. 2011) that include realistic physical effects and also additional mechanisms, such as the heating induced by DM annihilation (e.g., Valdes et al. 2013; Evoli et al. 2014).
Secondly, we performed the calculations in the full relativistic formalism for the derivation of the SZE (see, e.g., Colafrancesco et al. 2003 for details), that is suitable to calculate the SZE-21 cm in detail, and to derive the precise information about its spectral properties over a wide frequency range and in a wide set of cosmic structures. This general treatment allows, therefore, to increase both the number and the redshift distribution of objects that can be studied with this method, including galaxy clusters with high temperatures (which are the best targets for maximizing the SZE-21 cm signal and are more subject to relativistic effects), with radio halos, cool-cores and other complex morphologies, as well as other extragalactic sources with non-thermal electron distributions such as radio galaxies lobes.
The plan of the paper is the following: in Sect. 2 we present the general, full relativistic derivation of the SZE-21 cm and the models for the frequency distribution of the global 21-cm background we use in the paper. These are new crucial elements of the derivation of the SZE-21 cm that have never been provided up to date. In Sect. 3 we discuss the results of our calculations for various scenarios of the radiation background emerging from the DA and EoR, considering various astrophysically motivated scenarios. We also discuss here, for the first time, the derivation and the possibility to observe both the thermal and the non-thermal SZE-21 cm. We discuss our results in the light of the future radio interferometric experiments like the SKA in Sect. 4, and we summarize our conclusions in Sect. 5.
Throughout the paper, we use a flat, vacuum–dominated cosmological model with Ωm = 0.315, ΩΛ = 0.685 and H0 = 67.3 km s-1 Mpc-1.
2. Derivation of the SZE-21 cm
2.1. General derivation of the SZE for a modified CMB spectrum
The spectral distortion due to the SZE of the CMB is given in the general form by 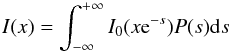 (1)(see Colafrancesco et al. 2003 for a general derivation of the SZE), where x = hν/ (kT0) is the normalized photon frequency, T0 is the CMB temperature, P(s) is the photon redistribution function (yielding the probability of a logarithmic shift s = ln(ν′/ν) in the photon frequency due to the inverse Compton scattering process) that depends on the electron spectrum producing the CMB comptonization, and I0(x) is the specific intensity of the incident CMB radiation field.
The redistribution function P(s), that contains the relativistic corrections required to describe correctly the Compton scattering produced by high temperature or relativistic electrons, is given by the sum of the probability functions to have n scatterings, Pn(s), weighted by the corresponding Poissonian probability: 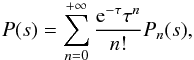 (2)where the optical depth is given by the integral along the line of sight ℓ of the electron density
 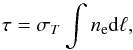 (3)where ne is the plasma electron density. Each function Pn(s) is given by the convolution product of n single scattering probability functions P1(s):
 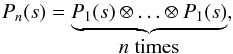 (4)where
 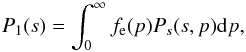 (5)and where fe(p) is the electron momentum distribution function (normalized as to have
  ), and Ps(s,p) is the function that gives the probability to have a frequency shift s by an electron with adimensional momentum p = βγ, and is given by the physics of the inverse Compton scattering process (see, e.g., Enßlin & Kaiser 2000; Colafrancesco et al. 2003).
The function P(s) that we use in our approach can be calculated at the desired approximation order in the plasma optical depth τ or via a general relativistic method by using Fourier transform properties (see Colafrancesco et al. 2003 for details), at variance with the case discussed in Cooray (2006) that is only a non-relativistic approximation for values τ ≪ 1.
Once the comptonized spectrum given by Eq. (1) is calculated, the general form of the SZE is given by the difference:  (6)For the incoming radiation spectrum I0(x) it is possible, in our general derivation, to use any radiation field. In the original derivation of the SZE the incoming spectrum is given by the standard CMB spectrum
  (7)that, inserted in Eq. (1) and using Eq. (6), allows to obtain the standard SZE ΔIst(x).
Our general derivation allows to use the CMB spectrum modified by other physical effects, such as the possible effect of the photon decay (Colafrancesco & Marchegiani 2014), the effect of non-planckian deviation of the CMB due to the effect of the plasma frequency in an ionized medium (Colafrancesco et al. 2015), or – as we study in this paper – by the modifications of the CMB provided by mechanisms yielding the 21-cm radiation field.
For the case of the CMB spectrum modified by the effects during the DA and EoR, the expression of the CMB, written as a function of the frequency ν, is given by  (8)where the modification to the CMB spectrum, δI(ν), can be expressed in terms of brigthness temperature change relative to the CMB, defined as:
  (9)In the next Sect. 2.2 we will discuss how to obtain the function δI(ν). Using Eqs. (1) and (6), the SZE-21 cm reads:
  (10)In the following, we will express the SZE using the brightness temperature change relative to the CMB:
  (11)that is valid for both the standard, ΔTst(ν) and the SZE-21 cm, ΔTmod(ν).
2.2. The CMB spectrum modified during the DA and EoR
The CMB radiation spectrum is modified during the DA and EoR by various physical mechanisms: subsequent to recombination, the temperature of neutral gas is coupled to that of the CMB, and no changes in the CMB spectrum can be observed. At redshifts below 200 the gas cools adiabatically, its temperature drops below that of the CMB, and neutral hydrogen resonantly absorbs CMB photons through the spin-flip transition (Field 1959; Scott & Rees 1990; Loeb & Zaldarriaga 2004). Heating effects of the neutral gas may also occur at high redshifts. As the first DM clumps form in the early Universe, the DM WIMP annihilation can in fact produce a substantial heating of the surrounding IGM (Valdes et al. 2013). At much lower redshifts, gas temperature is also expected to heat up again the IGM as luminous sources turn on and their UV and soft X-ray photons re-ionize and heat the gas (Chen & Miralda-Escude 2004). An additional spectral signature is also expected from the Ly-α radiation field produced by first sources (Barkana & Loeb 2005b) that is coupled to the CMB spectrum through the Wouthuysen-Field effect (Wouthuysen 1952; Field 1959), producing a suppression of the radiation field (see Furlanetto et al. 2006 for details).
As a result of these physical mechanisms, the CMB spectrum is modified depending on the redshift at which these mechanisms take place. The spectral shape of the brightness temperature change relative to the CMB (see Eq. (9)) is shown in Fig. 1, where the background radiation models are calculated with numerical simulations performed using the 21 cmFAST code (Evoli, priv. comm.) for different assumptions on the physical processes occurring during the EoR, and without and with DM annihilation effects.
The first one (solid line) is a fiducial model without DM, with standard assumptions on the properties of heating by cosmic structures (see Valdes et al. 2013 and Evoli et al. 2014 for details), without considering the effect of gas collisions which can be observed at frequencies ν< 30 MHz, and therefore can not be detected with a ground-based telescope like the SKA. This fiducial model takes into account the effects of the Ly-α radiation field at z ~ 30−20, and the effects of UV ionization and X-ray photon heating at z ~ 20−6. We use this modified CMB radiation field scheme as a benchmark case for the sake of a general discussion of the SZE-21 cm.
A second model without DM that we consider here assumes extreme values for the heating by cosmic structures and, as a result, the deep brightness decrease caused by the coupling of the spin temperature of the IGM with the Ly-α photons is damped, while the emission at higher frequencies is amplified. We finally consider two models with the fiducial parameters and with the heating effects produced by DM annihilation (Valdes et al. 2013): in these models, the strongest effect is produced by small mass DM halos, so we consider a model with minimum halo mass Mmin = 10-3M⊙, and one with Mmin = 10-6M⊙, which is more effective in damping the Ly-α coupling effect. The DM model used here is a WIMP with mass of 10 GeV and annihilation channel e+/e− with cross-section ⟨ σV ⟩=10-26 cm3/s.
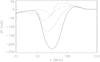 |
Fig. 1 Modified CMB spectrum emerging from the DA and EoR, in units of brightness temperature relative to the CMB (Evoli, priv. comm.): a fiducial model without DM (solid line; this is our benchmark model), an extreme model without DM (dashed line), a fiducial model with DM with Mmin = 10-3M⊙ (dot-dashed line), where Mmin is the mass of the smallest DM subhalo, and a fiducial model with DM with Mmin = 10-6M⊙ (three dots-dashed line). |
2.3. The SZE-21 cm spectrum in the benchmark background radiation model
The modified CMB spectrum (Eqs. (8) and (9), where δT is shown in Fig. 1) is then scattered by electrons (of both thermal and non-thermal nature) residing in the atmospheres of various cosmic structures, like galaxy clusters, radiogalaxy lobes and galactic halos, and the SZE-21 cm is produced. In Fig. 2 we show an example of the SZE-21 cm, ΔTmod, calculated in a galaxy cluster with a temperature of kT = 7 keV, and using the benchmark model for the modified CMB spectrum shown in Fig. 1.
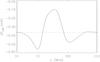 |
Fig. 2 SZE-21 cm (in units of brightness temperature relative to the CMB) for a thermal plasma at temperature kT = 7 keV and with τ = 5 × 10⁻³ (solid line). With the dashed line the standard SZE ΔTst for the same parameters is plotted for comparison. |
Figure 2 shows that in some frequency bands the SZE-21 cm is stronger than the standard one, whereas in other bands it is weaker. This behaviour is mainly related to the curvature of the input spectrum δT (see Fig. 1): in the frequency range where the input spectrum has a negative curvature (i.e., for ν ≲ 55 MHz and 90 ≲ ν ≲ 140 MHz for our fiducial model), the SZE-21 cm is smaller than the standard one (i.e. ΔTmod−ΔTst< 0), while at frequencies where the curvature is positive (55 ≲ ν ≲ 90 MHz and ν ≳ 140 MHz) we have ΔTmod−ΔTst> 0. This is due to the fact that the inverse Compton scattering produces a shift in the frequency of photons and, as a consequence, the amplitude of the SZE at a certain frequency depends on the distribution of the photons around that frequency (see, e.g., the shape of the function P1(s) defined in Eq. (5) in Colafrancesco et al. 2003). As a result, at the frequency where the curvature of the input spectrum is negative, a smaller number of photons are present around that frequency with respect to the case of the standard CMB spectrum (where the spectral curvature, in brightness temperature units, is zero), and the resulting SZE-21 cm is smaller than the standard one; on the other hand, where the curvature is positive a larger number of photons is present and the SZE-21 cm is higher than the standard one.
We also find that the minimum point in the input radiation spectrum (ν ~ 70 MHz) corresponds to a maximum point in the SZE-21 cm; this is due to the fact that a minimum point in the input radiation spectrum means a smaller number of photons with respect to the standard CMB: as a consequence, when subtracting the input spectrum to calculate the SZE-21 cm (see Eq. (10)), the resulting emission is stronger than for the standard SZE. The opposite behaviour is observed at the frequencies where the input radiation spectrum has its maximum points (ν ~ 45 and 120 MHz), that are close to the minimum points of the SZE-21 cm; in this case, the correspondence is less precise with respect to the previous case because the maximum points in the input spectrum are less sharped than the minimum one, and the convolution of photons with those at surrounding frequencies produces a slight shift in the frequency of the minimum points in the SZE-21 cm.
In the following we will discuss more detailed and new results obtained for the specific case of the SZE-21 cm produced by i) thermal electron populations, that provide the dominant contribution to the SZE observed in galaxy clusters; and by ii) non-thermal electrons populations, that are present in clusters that show non-thermal activity (i.e. radio halos or relics) and in the extended lobes of radiogalaxies. This can be done by using the corresponding functions fe(p) in Eq. (5), that is a maxwellian distribution for a thermal population and a power-law distribution for a non-thermal population. A specific analysis on the relevance of relativistic effects in the SZE-21 cm is also presented.
3. The SZE-21 cm: detailed spectral analysis
In the following we will discuss first our results obtained for the benchmark modified background radiation scenario (solid line in Fig. 1), and then for the set of other modified radiation background models that are also shown in Fig. 1.
We start our discussion, for the sake of clarity, by showing the spectral shape of the standard SZE, ΔTst, for the unmodified CMB spectrum. Figure 3 shows the standard SZE, not modified by the 21-cm line radiation field, in units of brigthness temperature relative to the CMB for the case of a galaxy cluster with thermal plasma at temperature kT = 5 keV and with optical depth τ = 5 × 10⁻³, and for the case of a non-thermal plasma with a single power-law spectrum N(p) ~ p− s for p ≥ p1, with s = 3.5, p1 = 10 and τ = 1 × 10⁻⁴. We notice that the standard SZE is a constant line in units of CMB brightness temperature in the Rayleigh-Jeans (RJ) regime (hν ≪ kTCMB) for both the case of a thermal SZE and for the case of a non-thermal, relativistic plasma typical of the radiogalaxy lobes (we assume here a steep spectrum Sν ∝ ν− αR with αR = (s−1) / 2 = 1.25)
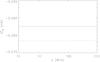 |
Fig. 3 Standard SZE (in units of brightness temperature relative to the CMB) for a thermal plasma (kT = 5 keV and τ = 5 × 10⁻³; solid line) and for a non-thermal plasma (s = 3.5, p1 = 10 and τ = 1 × 10⁻⁴; dashed line). The SZE is shown in the radio frequency range where the 21-cm radiation background are visible. |
The thermal SZE-21 cm, ΔTmod, is shown in Fig. 4 for the case of thermal plasma in galaxy clusters for four different electron temperatures of 5, 10, 15 and 20 keV. We find that the spectral shape of the thermal SZE-21 cm changes for different electron temperatures, consistently with the effects of relativistic corrections that are fully considered in our approach, while its amplitude increases with the cluster temperature, which is consistent with the notion that the SZE amplitude increases with increasing cluster Compton parameter  , that reads y ∝ kT·τ for the case of a isothermal intracluster medium (Colafrancesco et al. 2003).
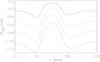 |
Fig. 4 SZE-21 cm (in units of brightness temperature relative to the CMB) for thermal plasma at temperature kT = 5, 10, 15 and 20 keV, shown by the solid, dashed, dot-dashed and dash-three dots lines, respectively. A constant value τ = 5 × 10⁻³ has been used in the calculations. |
We verified the level of the error done when using a non-relativistic approach to calculate the SZE-21 cm with respect to our full relativistic approach. In Fig. 5 we show the percentage difference between the results of the two calculations for clusters with electron temperatures of 20, 15 and 7 keV calculated with the relativistic and the non-relativistic approaches (as in the case of Cooray 2006). We find that the percentage difference is different from 0 (i.e., the case in which the non-relativistic calculation gives the same result than the relativistic one) at almost all frequencies. As discussed in details in Appendix A, we also note that the percentage difference has local maxima (in absolute value) in correspondence of the points where the second derivative of the input spectrum has its maxima and minima, i.e. at ν ~ 50, 60, 77 and 95 MHz (see lower panel in Fig. A.1). This is related, as discussed for the shape of the SZE-21 cm, to the fact that the SZE is produced by a convolution of the input-spectrum photon distribution with photons at surrounding frequencies. The non-relativistic calculation considers a shape of the function P(s) which is narrower than the one in the relativistically correct calculation (see, e.g., Birkinshaw 1999; Colafrancesco et al. 2003). Therefore, when the curvature (positive or negative) of the input radiation spectrum is maximum, the error done by convolving the input spectrum with a function P(s) narrower than the correct one is larger, because it implies to lose the contribution from photons with farther frequencies. As a consequence, the more the input spectrum is different from a straight line, the larger is the error done by using the non-relativistic calculation. In Appendix A we expand these considerations by discussing also the other three input models considered for the input radiation spectrum we use in this paper.
For the case of a cluster with a temperature of 20 keV, the percentage difference reaches at its local maxima/minima values of the order of ≈ 65%, ≈ 60%, ≈ 100%, and ≈ 50% at frequencies ν ≈ 50, 60, 77, 95 MHz, respectively, which introduce therefore substantial modifications in the value of the SZE-21 cm calculated in the non-relativistic approach. For the other temperatures, the percentage error is smaller, but still of the order of at least 30% at the previous frequencies, while at ~ 77 MHz the percentage error is ~ 100% independently on the cluster temperature. For this reason we conclude that in order to perform a correct study of the SZE-21 cm it is mandatory to use the full relativistic formalism as described in our paper.
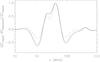 |
Fig. 5 Percentage difference between the relativistic result and the non-relativistic one for the SZE-21 cm for galaxy clusters with temperatures of 20 keV (solid line), 15 keV (dashed line) and 7 keV (dot-dashed line). |
In Fig. 6 we show the difference between the value of ΔT for the thermal SZE-21 cm and the standard thermal SZE on the unmodified CMB (note that this last SZE is a constant value for all frequencies in the considered range, as shown in Fig. 3) in order to highlight the spectral difference between the two effects and between the thermal effects calculated for different electron temperatures. We notice that the main differences appear around 50 MHz and in the range ≈ 60−80 MHz (reflecting the Lyα spin coupling effect), and in the range 100−150 MHz (reflecting the UV ionization effect during the EoR).
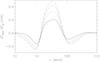 |
Fig. 6 Difference between the SZE-21 cm and the standard SZE (in units of brightness temperature relative to the CMB) for thermal plasma at temperature kT = 5, 10, 15 and 20 keV, shown by the solid, dashed, do-dashed and dash-three dots lines, respectively, as in Fig. 4. A constant value τ = 5 × 10⁻³ has been used in these calculations. |
To investigate the non-thermal SZE-21 cm effect produced by non-thermal (or relativistic) electrons residing, e.g., in radiogalaxy lobes or in cluster radio halos/relics, we considered an electron population with a single power-law spectrum with index s = 3.5 and various values of the minimum electron momentum p1. Figure 7 shows the non-thermal SZE-21 cm for values p1 = 0.1, 1, 5 and 10. The non-thermal SZE-21 cm has an amplitude that increases (in modulus) with increasing values of p1, for a constant value of τ. We show in Fig. 8 the difference between the non-thermal SZE-21 cm and the standard non-thermal SZE where the CMB spectrum is not modified. The largest differences of the non-thermal SZE-21 cm with respect to the standard one take place at frequencies similar to the thermal case, and the differences with the thermal case are more important for high values of p1, i.e. when the scattering electrons are more energetic.
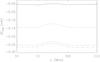 |
Fig. 7 SZE-21 cm (in units of brightness temperature relative to the CMB) for non-thermal electrons with a power-law spectrum with s = 3.5 and p1 = 0.1, 1, 5 and 10, shown by the solid, dashed, dot-dashed and dash-three dots lines, respectively. A constant value τ = 1 × 10⁻⁴ has been used in the calculations. |
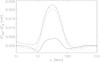 |
Fig. 8 Difference between the SZE-21 cm and the standard SZE (in units of brightness temperature relative to the CMB) for non-thermal electrons with a power-law spectrum with s = 3.5 and p1 = 0.1, 1, 5 and 10, shown by the solid, dashed, dot-dashed and dash-three dots lines, respectively. A constant value τ = 1 × 10⁻⁴ has been used in the calculations. |
We also checked how the shape of the SZE-21 cm depends on the frequency of the modifications to the overall radiation field, that depends on the assumed redshift range in which the various mechanisms operating during the DA and EoR act to modify the original CMB spectrum. To this purpose, for an illustrative description of the possible redshift-dependence of the overall modified background model, we show the frequency shape of the resulting SZE-21 cm when the redshift of the input modified radiation field is varied. To this aim, we use a typical galaxy cluster with a thermal electron plasma at a temperature of 7 keV and optical depth τ = 5 × 10⁻³, and we compare the total SZE-21 cm as previously discussed with the one in which the background spectrum is shifted globally in frequency by a factor 3 (see Fig. 9). With this illustrative example, we are considering the possibility that the redshifts at which the various phenomena (e.g., collisions, Ly-α interactions, UV ionization) can be different from the ones assumed in the benchmark model. Thus, from the frequency at which the different effects in the SZE-21 cm are observed, it is possible to derive the redshift at which these effects took place, and in principle determine the full cosmic history of the DA and EoR.
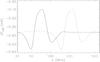 |
Fig. 9 For an illustrative description of the possible redshift-dependence of the overall modified background model, we show the SZE-21 cm (in units of brightness temperature relative to the CMB) for a thermal plasma at temperature kT = 7 keV and with τ = 5 × 10⁻³ for the modified CMB spectrum with the values of z taken from the original model (solid line), and for a modified CMB spectrum in which all components are globally shifted in frequency by a factor 3 (dashed line). |
By using the other models of the modified radiation background described in Sect. 2.2, we obtained the results shown in Fig. 10, where the thermal SZE-21 cm spectrum for clusters with 5 and 20 keV is plotted, and in Fig. 11, where instead the non-thermal SZE-21 cm with s = 3.5 and p1 = 0.1 and 10 is plotted. As we can see, while the spectral shape of the non-thermal SZE-21 cm is very similar to the thermal one for p1 = 0.1, for high values of p1 the main difference is the damping of the features produced by the Ly-α spin coupling effect at ~ 60 and 100 MHz. The effect of considering a higher heating rate, both from usual astrophysical sources and from DM, is to increase the temperature of the IGM, to which the spin temperature is linked by the Ly-α coupling, and as a result the peak in the SZE-21 cm in the 60–80 MHz frequency range is damped, with different spectral shapes depending on the DM properties.
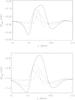 |
Fig. 10 SZE-21 cm (in units of brightness temperature relative to the CMB) for a thermal plasma at temperature kT = 5 keV (upper panel) and 20 keV (lower panel) and with τ = 5 × 10⁻³ for a modified CMB spectrum with a fiducial model without DM (solid line), an extreme model without DM (dashed line), a fiducial model with DM with Mmin = 10-3M⊙ (dot-dashed line), and a fiducial model with DM with Mmin = 10-6M⊙ (three dots-dashed line). |
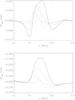 |
Fig. 11 SZE-21 cm (in units of brightness temperature relative to the CMB) for a non-thermal plasma with s = 3.5 and p1 = 0.1 (upper panel) and 10 (lower panel) and with τ = 1 × 10⁻⁴ for a modified CMB spectrum with a fiducial model without DM (solid line), an extreme model without DM (dashed line), a fiducial model with DM with Mmin = 10-3M⊙ (dot-dashed line), and a fiducial model with DM with Mmin = 10-6M⊙ (three dots-dashed line). |
These results therefore show that the SZE-21 cm can be also considered as a tool to probe both the amount of DM in the Universe and the minimal mass of DM halos collapsed at early epochs. The DM abundance can be probed using the amplitude and the spectral shape of the SZE-21 cm in two best frequency ranges: around ~ 50 MHz and at ≈ 60−90 MHz, where the sensitivity to the DM density is higher. The sensitivity to Mmin for the DM halos is best achievable at ν ≈ 50−70 MHz where the effect of Mmin increases the amplitude of the SZE-21 cm and shifts its maximum in frequency.
4. Discussion
In the full relativistic description of the SZE-21 cm we found that the following properties are important for the correct use of this technique:
-
i)
The scattering properties of high-energy electrons need a fullrelativistic treatment: avoiding this will generate percentagedifferences up to about 100% at the relevant frequencies wherethis effect can be observed. This is ensured in our approachthrough a self-consistent computation of theSZE-21 cm.
-
ii)
We found that the amplitude of the SZE-21 cm and its variations with respect to the standard SZE (using the non-modified CMB spectrum) are larger for clusters with high temperature (see Fig. 6) and for non-thermal electron plasmas with high values of the minimum momentum p1 (see Fig. 8), i.e. when the high-energy electrons are more important.
-
iii)
Studying the detailed spectrum of the SZE-21 cm allows to derive precise information on the epochs at which the CMB has been modified and on the physical mechanisms that produced such modifications during the DA and EoR (see Fig. 9).
-
iv)
The thermal and non-thermal SZE-21 cm have peculiar spectral shapes (see Figs. 6, 8 and 10–11). Thus, it is possible, in principle, to derive information on the existence and the properties of the electron population in cosmic structures also from very low-ν observations of the SZE. We note that this property is complementary with the results of previous studies, in accordance with which the properties of non-thermal electrons can be derived from the study of the SZE at high frequencies (see, e.g., Colafrancesco et al. 2011 for the case of the Bullet Cluster).
4.1. Differential analysis technique and foreground contamination
Observations of the SZE-21 cm can be carried out with radio interferometers since the modification associated with low-redshift scattering can be established from differential observations towards and away from galaxy clusters and other cosmic structures containing diffuse thermal and non-thermal plasmas. Unlike an experiment to directly establish the cosmic 21-cm frequency spectrum at low radio frequencies involving a total intensity measurement of the sky, the differential observations with a radio interferometer are less affected by issues such as the exact calibration of the observed intensity using an external source, and the confusion from galactic foregrounds that are uniform over angular scales larger than a typical cluster, such as the Galactic synchrotron background at low radio frequencies. Also, since the SZE does not depend on redshift, it is more suitable to study sources located at large distances, allowing to reduce the importance of the cluster radio emissions (both diffuse and discrete sources) with respect to the SZE, and allowing to detect a larger number of sources, thus increasing the possibility to obtain more precise results by studying this effect in many sources at cosmological scales.
The resulting modification to the 21-cm spectrum due to the thermal SZE-21 cm is expected at the level of a few tenths mK brightness temperature relative to the CMB. Therefore, such a small modification challenges an easy detection, but for upcoming radio interferometers (like the SKA), the specific spectral signatures would allow to produce a relatively clean detection. In addition, multi-object SZE-21 cm observations could be facilitated by the fact that the instantaneous field-of-view of upcoming interferometers is expected to be more than 100 square degrees and one expects to detect simultaneously hundreds, or more, massive clusters in such wide fields.
Therefore, the SZE-21 cm effect can be effectively used to establish the global features in the mean 21-cm spectrum generated during and prior to the EoR. We note that it is also possible to produce cluster population studies with the SZE-21 cm (e.g., cluster counts and redshift distribution) and use them as cosmological probes. These goals make desirable to build a technique allowing to study a large number of objects (including galaxy clusters in merging and relaxed states, radio halo and cooling flow clusters, radio galaxy lobes), and to study objects at high redshift.
Even if the differential measurements of the SZE-21 cm avoid contamination from foreground/background emissions on scales larger than the cluster/radiogalaxy size, another possible source of contamination is the synchrotron radio emission within galaxy clusters and radio galaxies lobes. This contamination should decrease for objects at large distances, because the synchrotron emission varies with the luminosity distance as  , whereas the SZE does not vary with the distance of the source. For nearby objects, the synchrotron emission at low frequencies can be much stronger than the SZE. In Fig. 12 we show a comparison between two cases of the SZE-21 cm (for thermal plasma with temperature of 5 and 20 keV and optical depth τ = 5 × 10⁻³), a spectrum similar to that of the Coma radio halo (approximated as a perfect power law), and a spectrum of a Coma-like cluster located at z = 1. We note the at all frequencies we are interested, the synchrotron emission is much larger than the SZE for a nearby cluster like Coma; so, it is necessary to study the cluster radio halo spectrum to separate the two contributions. At higher-z, however, the radio halo flux decreases rapidly while the SZE-21 cm remains unchanged thus providing a lower level of contamination and an easier subtraction procedure.
Another possible source of contamination is given by the discrete radio sources in galaxy clusters; in this case, the goal to separate this contribution from the SZE-21 cm signal is easier, since it is possible to use both the spectral information we have at other frequencies and the spatial information, in order to remove the contribution from discrete sources.
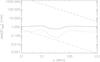 |
Fig. 12 SZE-21 cm (in units of brightness temperature relative to the CMB and in absolute value) for a thermal plasma with temperature kT = 20 keV (solid line) and 5 keV (dashed line), and with τ = 5 × 10⁻³, compared with a spectrum similar to that of Coma radio halo (long-dashed line), and with the same spectrum for a Coma-like cluster located at z = 1 (three dots-dashed line). |
4.2. Detectability with SKA
We discuss now the detectability of the SZE-21 cm with the SKA1-low instrument. We extracted the performance of SKA1-low from the SKA1 System Baseline Design document (see Dewdney et al. 2012).
First of all, we calculate the loss of signal at small angular radii produced by the finite extension of the interferometer. For this purpose, we calculate the SZE flux from an isothermal cluster with a gas density profile given by a β-profile: ![Mathematical equation: \begin{equation} n_{\rm e}(r)=n_{\rm e,0}\left[1+ \left( \frac{r}{r_{\rm c}} \right )^2 \right ]^{-\frac{3}{2}\beta} \end{equation}](/articles/aa/full_html/2016/11/aa24904-14/aa24904-14-eq108.png) (12)(Cavaliere & Fusco-Femiano 1976). For such a cluster, the optical depth at a projected distance θ from the center of the cluster is given by the expression:
(12)(Cavaliere & Fusco-Femiano 1976). For such a cluster, the optical depth at a projected distance θ from the center of the cluster is given by the expression: ![Mathematical equation: \begin{equation} \tau(\theta)=\tau_0 \left [1+\left(\frac{\theta}{\theta_{\rm c}}\right)^2\right]^{\frac{1}{2}-\frac{3}{2}\beta} \label{tau_profile} \end{equation}](/articles/aa/full_html/2016/11/aa24904-14/aa24904-14-eq110.png) (13)(Colafrancesco et al. 2003), where θc = rc/DA and DA is the angular diameter distance of the cluster. We assume τ0 = 5 × 10⁻³, β = 0.75, θc = 300 arcsec and calculate the flux up to an angular size θmax = 10θc.
(13)(Colafrancesco et al. 2003), where θc = rc/DA and DA is the angular diameter distance of the cluster. We assume τ0 = 5 × 10⁻³, β = 0.75, θc = 300 arcsec and calculate the flux up to an angular size θmax = 10θc.
The reference spatial resolution of SKA1-low at 110 MHz, corresponding to a minimum baseline of 50 km, is θmin ~ 11 arcsec. Since at first order in τ the SZE-21 cm is proportional to the product of the SZE spectral function and of the cluster optical depth (see, e.g., Colafrancesco et al. 2003), we can estimate that the lack of sensitivity for angular scales θ<θmin is given by the ratio between the optical depth integrated in this small θ range and the total one, and it implies a signal loss of the order of  (14)To have an idea about the intensity of the signal we should expect, we plot in Fig. 13 the surface brightness profiles of the standard SZE at the frequency of 110 MHz for the optical depth profiles in Eq. (13), with the same parameters values described above, and for temperatures of 20, 15, 10, and 5 keV. Therefore, in the inner part (e.g., within a radius of ~ 20 arcmin) of a galaxy cluster with high temperature we can estimate an SZE signal of the order of ~ 10 μJy and, as a consequence, the loss of signal due to the finite baseline configuration of the SKA1 is of the order of ~nJy, and therefore does not affect our results.
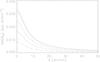 |
Fig. 13 Surface brightness profile of the standard SZE in absolute value for thermal plasma with temperatures kT = 20 (solid line), 15 (dashed), 10 (dot-dashed) and 5 (three dots-dashed) keV, and calculated for τ0 = 5 × 10⁻³, θc = 300 arcesc, β = 0.75, θmax = 10θc. |
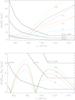 |
Fig. 14 Upper panel: spectra of the fluxes of the SZE-21 cm ΔImod (in units of μJy and in absolute value with the solid lines) and the SZE for a non-modified CMB ΔIst (dashed lines). Lower panel: absolute value of the difference between the SZE-21 cm and the standard SZE for a non-modified CMB. Both panels are using for the modified CMB the fiducial model without DM (solid line in Fig. 1). Both panels are for thermal plasma with temperatures kT = 20 (green), 15 (black), 10 (red) and 5 (cyan) keV, and calculated for τ0 = 5 × 10⁻³, θc = 300 arcesc, β = 0.75, θmax = 10θc, compared with the SKA-50%, SKA1-low, and SKA 2 sensitivities for 100 kHz bandwith, 1000 h of integration, 2 polarizations, no taper, no weight (thick lines). |
To study the detectability of the SZE-21 cm signal, we compare the flux calculated for the modified CMB spectrum, ΔImod, and the one calculated for the non-modified CMB spectrum, ΔIst, with the sensitivities of SKA-50%, SKA1, and SKA2 for 100 kHz bandwith, 1000 h of integration, 2 polarizations, no taper, no weight. We show the result in Figs. 14–17 for the different radiation background models we use in this paper.
For our benchmark model, the SZE-21 cm can be detected with SKA1-low with 1000 h integration time at frequencies ν ≳ 75 MHz for clusters with very high temperature (kT = 20 keV) and at ν ≳ 90 MHz for low temperature clusters (kT = 5 keV). With SKA-50% the SZE-21 cm can be detected at higher frequencies (85 and 100 MHz for hot and cold clusters respectively), and with SKA2 it can be detected at low frequencies (50 and 80 MHz), giving the possibility to study the EoR and the DA up to very high redshift (z ~ 30).
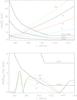 |
Fig. 15 Like Fig. 14 but for an extreme model without DM for the modified CMB (dashed line in Fig. 1). |
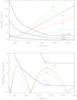 |
Fig. 16 Like Fig. 14 but for a fiducial model with DM with Mmin = 10-3M⊙ for the modified CMB (dot-dashed line in Fig. 1). |
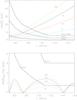 |
Fig. 17 Like Fig. 14 but for a fiducial model with DM with Mmin = 10-6M⊙ for the modified CMB (three dots-dashed line in Fig. 1). |
The possibility to discriminate between the SZE-21 cm and the standard SZE signals is more challenging: the difference between the two signals is always at most of the order of few μJy (see lower panel in Fig. 14), so it requires to measure the signal with high precision, and at frequencies where the differences are larger. Good frequency channels for this purpose can be found at ~75 MHz (where the SZE-21 cm is lower than the standard SZE because of the Ly-α coupling effect), and at 100–110 MHz (where the SZE-21 cm is stronger because of the UV ionization effect). Because of the better sensitivity of SKA1-low at its high frequency band, the best frequency range where we can obtain information on the SZE-21 cm is ν ≳ 100 MHz. However, also in this frequency range the difference between the two signals is of the order of μJy, so very deep observations, and very accurate data analysis procedures are required for this purpose, together with the fact that it is necessary to use clusters with high values of electron temperature and optical depth.
We further show that with SKA2 the difference between the modified and the standard SZE can be detected at frequency ν ≳ 60 MHz in galaxy clusters with temperature kT ≳ 15 keV and at ≳ 65 MHz in clusters with temperature kT ≳ 10 keV for an integration time of 1000 h.
For the other models we use, detecting the difference between the modified and the standard SZE is more challenging. In general, it is not possible to detect this difference with the SKA1; only in the case of the model with DM with Mmin = 10-3M⊙ it would be possible detect this difference by increasing the integration time by a factor ~ 3 for the hottest clusters at a frequency around 110 MHz. With the SKA2, the detection is possible at frequencies 85–120 MHz (only for cluster temperatures kT> 10 keV) and ≳ 145 MHz for the case of extreme heating without DM, at 65–75 MHz (only for kT ~ 20 keV) and 95–145 MHz in the case of the model with DM with Mmin = 10-3M⊙, and at 95–135 MHz and ≳ 150 MHz (for kT ≳ 10 keV) in the case of the model with DM with Mmin = 10-6M⊙.
A promising strategy can be designed to study the SZE at higher frequencies (with experiments like, e.g., SPT, ACT, Millimetron) in order to derive precise information on the parameters of the ICM, and then use these constraints to obtain a better estimate of the properties of the SZE-21 cm with SKA1-low and SKA2.
5. Conclusions
The goal of obtaining information on the physical processes occurred during the DA and EoR by measuring the SZE-21 cm with SKA is challenging, but possible if pursued with good theoretical and observational strategies.
Observations have to be carried out towards high temperature and high optical depth clusters to maximize both the overall signal and the difference between the standard and the modified SZE. The best frequency ranges of observation of the SZE-21 cm are between ~90 and 120 MHz, where the difference between the standard and the modified SZE is maximum. In our benchmark model, the sensitivity of SKA1-low is good enough to detect this difference with 1000 h of integration, whereas for the other background models the difference between the standard and the modified SZE can be detected only with SKA2 for the same integration time in frequencies bands that depend on the background model and on the temperature of the cluster.
Together with very deep observations, a very accurate theoretical analysis is required, where the full formalism to calculate the SZE and detailed models for describing the effect of the cosmological 21-cm background on the CMB spectrum have to be used. In addition, we found that a very important strategy will be the detailed study of the SZE at higher frequencies in order to estimate the gas parameters to be used as prior constraints for the study of the SZE-21 cm at low frequencies.
Observations in the frequency bands of SKA1-mid are also very important to disentangle the SZE from the cluster synchrotron emission. In this respect, the use of high-redshift clusters can alleviate the problem, since the radio emission decreases as , whereas the SZE is not depending on the cluster distance.
The detection of the non-thermal SZE-21 cm appears to be more challenging, since the signal is much fainter than the thermal one, especially regarding the difference between the standard and the modified SZE, that can be also a factor of ~ 102 smaller with respect to the thermal case. However, the different spectral features can allow, in principle, a detection of this signal and hence an estimate of non-thermal cluster properties independently of measurements in other spectral bands. We note here that it is possible to strategize the search of this signal in objects where the non-thermal components are dominant, such as in the case of radio galaxies lobes. In this case, objects with more energetic electrons (i.e. with harder radio spectra), large optical depth (for which a good indication could be a strong radio luminosity) and high redshift are preferable.
The independence of the SZE from the redshift can allow the study of the SZE-21 cm in a larger number of objects spread over a wider redshift range, therefore producing statistical studies aimed at maximizing the detectable signal, and detect the properties of the 21-cm background and of the early DM halos over a large set of spatial directions, allowing in such a way a better understanding of the full cosmic history of the physical processes occurring in the dark ages and the epoch of reionization.
Acknowledgments
S.C. acknowledges support by the South African Research Chairs Initiative of the Department of Science and Technology and National Research Foundation and by the Square Kilometre Array (SKA). P.M. and M.S.E. acknowledge support from the DST/NRF SKA post-graduate bursary initiative. We thank C. Evoli for providing the numerical files of the models in Fig. 1, and A. Ferrara, M. Birkinshaw and A. Tailor for useful discussions. We thank the Referee for several useful comments and suggestions that allowed us to improve the presentation of our results.
References
- Barkana, R., & Loeb, A., 2001, Phys. Rept., 349, 125 [Google Scholar]
- Barkana, R., & Loeb, A., 2005a, ApJ, 624, L65 [NASA ADS] [CrossRef] [Google Scholar]
- Barkana, R., & Loeb, A., 2005b, ApJ, 626, 1 [NASA ADS] [CrossRef] [Google Scholar]
- Bharadwaj, S., & Ali, S. S. 2004, MNRAS, 352, 142 [NASA ADS] [CrossRef] [Google Scholar]
- Birkinshaw, M. 1999, Phys. Rep., 310, 97 [NASA ADS] [CrossRef] [Google Scholar]
- Bromm, V., & Larson, R. B. 2004, ARA&A, 42, 79 [NASA ADS] [CrossRef] [EDP Sciences] [Google Scholar]
- Carilli, C. L., Furlanetto, S., Briggs, F., et al. 2004, New Astron. Rev., 48, 1029 [NASA ADS] [CrossRef] [Google Scholar]
- Cavaliere, A., & Fusco-Femiano, R. 1976, A&A, 49, 137 [NASA ADS] [Google Scholar]
- Chen, X. L., & Miralda-Escude, J. 2004, ApJ, 602, 1 [NASA ADS] [CrossRef] [Google Scholar]
- Choudhury, T. R., & Ferrara, A. 2006, ArXiv e-prints [arXiv:astro-ph/0603149] [Google Scholar]
- Ciardi, B., & Ferrara, A. 2005, Space Sci. Rev., 116, 625 [NASA ADS] [CrossRef] [Google Scholar]
- Colafrancesco, S., & Marchegiani, P. 2014, A&A, 562, L2 [NASA ADS] [CrossRef] [EDP Sciences] [Google Scholar]
- Colafrancesco, S., Marchegiani, P., & Palladino, E. 2003, A&A, 397, 27 [NASA ADS] [CrossRef] [EDP Sciences] [Google Scholar]
- Colafrancesco, S., Marchegiani, P., & Buonanno, R. 2011, A&A, 527, L1 [NASA ADS] [CrossRef] [EDP Sciences] [Google Scholar]
- Colafrancesco, S., Emritte, M. S., & Marchegiani, P. 2015, J. Cosmol. Astropart. Phys., 05, 006 [NASA ADS] [CrossRef] [Google Scholar]
- Cooray, A. 2004, Phys. Rev. D, 70, 063509 [NASA ADS] [CrossRef] [Google Scholar]
- Cooray, A. 2006, Phys. Rev. D, 73, 103001 [NASA ADS] [CrossRef] [Google Scholar]
- de Oliveira-Costa, A., Tegmark, M., Gaensler, B. M., et al. 2008, MNRAS, 388, 247 [NASA ADS] [CrossRef] [Google Scholar]
- Dewdney, P., Turner, W., Millenaar, R., et al. 2012, SKA baseline design document, http://www.skatelescope.org/wp-content/uploads/2012/07/SKA-TEL-SKO-DD-001-1_BaselineDesign1.pdf [Google Scholar]
- Dillon, J. S., Liu, A., Williams, C. L., et al. 2014, Phys. Rev. D, 89, 023002 [NASA ADS] [CrossRef] [Google Scholar]
- Enßlin, T. A., & Kaiser, C. R. 2000, A&A, 360, 417 [NASA ADS] [Google Scholar]
- Evoli, C., Mesinger, A., & Ferrara, A. 2014, J. Cosmol. Astropart. Phys., 11, 024 [NASA ADS] [CrossRef] [Google Scholar]
- Field, G. B. 1959, ApJ, 129, 536 [NASA ADS] [CrossRef] [Google Scholar]
- Furlanetto, S. R., & Briggs, F. H. 2004, New Astron. Rev., 48, 1039 [NASA ADS] [CrossRef] [Google Scholar]
- Furlanetto, S. R., Oh, S. P., & Briggs, F. H. 2006, Phys. Rep., 433, 181 [NASA ADS] [CrossRef] [Google Scholar]
- Liu, A., et al. 2013, Phys. Rev. D, 87, 043002 [NASA ADS] [CrossRef] [Google Scholar]
- Loeb, A., & Barkana, R. 2001, ARA&A, 39, 19 [NASA ADS] [CrossRef] [Google Scholar]
- Loeb, A., & Zaldarriaga, M. 2004, Phys. Rev. Lett., 92, 211301 [NASA ADS] [CrossRef] [PubMed] [Google Scholar]
- McQuinn, M., et al. 2006, ApJ, 653, 815 [NASA ADS] [CrossRef] [Google Scholar]
- Mesinger, A., Furlanetto, S., & Cen, R. 2011, MNRAS, 411, 955 [NASA ADS] [CrossRef] [Google Scholar]
- Morales, M. F., & Wyithe, J. S. B. 2010, ARA&A, 48, 127 [NASA ADS] [CrossRef] [Google Scholar]
- Paciga, G., Albert, J. G., Bandura, K., et al. 2013, MNRAS, 433, 639 [NASA ADS] [CrossRef] [Google Scholar]
- Parsons, A. R., Liu, A., Aguirre, J. E., et al. 2014, ApJ, 788, 106 [NASA ADS] [CrossRef] [Google Scholar]
- Pritchard, J. R., & Loeb, A. 2010, Phys. Rev. D, 82, 023006 [NASA ADS] [CrossRef] [Google Scholar]
- Pritchard, J. R., & Loeb, A. 2012, Rep. Prog. Phys., 75, 086901 [NASA ADS] [CrossRef] [Google Scholar]
- Scott, D., & Rees, M. J. 1990, MNRAS, 247, 510 [NASA ADS] [Google Scholar]
- Valdes, M., Evoli, C., Mesinger, A., Ferrara, A., & Yoshida, N. 2013, MNRAS, 429, 1705 [NASA ADS] [CrossRef] [Google Scholar]
- Wouthuysen, S. A. 1952, AJ, 57, 31 [NASA ADS] [CrossRef] [Google Scholar]
- Zaroubi, S. 2013, The First Galaxies, Astrophys. Space Sci. Libr., 396, 45 [NASA ADS] [CrossRef] [Google Scholar]
Appendix A: The relation between the error done by using the non-relativistic calculation and the properties of the input radiation field
In this Appendix, we estimate the error done when the SZE-21 cm is calculated by using a non-relativistic approach, as a function of the properties of the input spectrum, using the four models shown in Fig. 1.
For the standard SZE, the input radiation is a Planck black-body spectrum which at low frequency has a constant brightness temperature, and the resulting SZE ΔTst is a constant as well (see Fig. 3). It is important to note that the Planck spectrum is a smooth function, and we noticed that because of this smoothness the difference between the use of a relativistic approach and a non-relativistic approach in computing the SZE is smaller for low electron temperatures and at low frequencies (see, e.g., Colafrancesco et al. 2003). However, when computing the SZE-21 cm, the shape of the input radiation spectrum plays an important role for the determination of the error done in the calculation of the SZE-21 cm using a non-relativistic approach.
To discuss this issue, we show the spectra of the SZE-21 cm calculated with the relativistic and the non-relativistic approach for the four input models we are using in this paper, and for a reference electron temperature of 7 keV (see Figs. A.1–A.4). The SZE-21 cm is also compared with the standard SZE calculated with the relativistic and the non-relativistic approach. We show that the use of the non-relativistic approach introduces an overall numerical error into the standard SZE, and that this error is amplified in a frequency-dependent way for the SZE-21 cm.
To better study the frequency dependence of this error, we also show the percentage error done in these cases, and we compare these results with the properties of the input spectrum. As discussed in Sect. 3, we expect that the most important factor in determining the error done with the non-relativistic approach is the curvature of the input radiation spectrum: if the input spectrum has a large curvature this implies that using a function P(s) that is narrower than the correct relativistic one (like in the non-relativistic approach) gives a result that is more different from the correct one with respect to the case where the input radiation spectrum is smooth, like in the case of the standard CMB. To check this conclusion, we compared the percentage error for the four models with the second derivative of the input radiation spectrum.
As expected, we found that the percentage difference between the relativistic and non-relativistic spectrum has maximum points lying at frequencies where there is a peak in the second derivative of the input radiation spectrum, corresponding to point of maximum curvature.
For the first model, we observe that there are two peaks in the frequency range 60–80 MHz in the case of the non-relativistic SZE-21 cm. The existence of these peaks depends on the fact that the input radiation spectrum has two peaks in its second derivative, and the effect of using the non-relativistic kernel introduces numerical artifacts due to the fact we are convolving the input radiation spectrum with a very narrow kernel (see Birkinshaw et al. 1999). With the correct relativistic kernel, the input spectrum is convolved with a wider function and the two peaks are then smoothed in only one peak. Therefore, the use of a non-relativistic approach gives origin not only to a numerical error in the value of the computed SZE, but also in its spectral shape and this error increases for increasing electron temperatures.
In the other models we consider in our paper, the second derivative of the input radiation spectrum has only one peak at frequencies ν ~ 60−70 MHz, and as a result also the non-relativistic SZE-21 cm has only one peak in this spectral range. It can be seen that there are peaks/troughs in the percentage difference at frequencies whereby peaks/troughs are in the second derivative of the input spectrum (e.g. at ν ~ 153 MHz for the second model). This shows that the smoothness of the input radiation spectrum is an important aspect which produces differences in computing the SZE spectrum using a relativistic or a non-relativistic approach.
To conclude, we have shown in this Appendix that there is a substantial numerical error when computing the SZE using a non-relativistic approach, in particular when the input radiation spectrum is not a smooth function, as in the case of the modified CMB giving rise to the 21-cm background. This means that when using SZE of cosmic structures to study the cosmological 21-cm, it is imperative to use a full relativistic computation in order to obtain the correct SZE amplitude and its spectral shape.
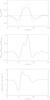 |
Fig. A.1 Spectral analysis of the first model (solid line) of Fig. 1. Upper panel: thermal SZE-21 cm for kT = 7 keV and τ = 5 × 10⁻³ calculated with the relativistic approach (solid line) and the non-relativistic approach (dashed line), compared with the standard SZE calculated with the relativistic approach (long-dashed line) and the non-relativistic approach (dotted line). Middel panel: percentage difference between the relativistic result and the non-relativistic one. Lower panel: second derivative of the input spectrum. |
All Figures
|
Fig. 1 Modified CMB spectrum emerging from the DA and EoR, in units of brightness temperature relative to the CMB (Evoli, priv. comm.): a fiducial model without DM (solid line; this is our benchmark model), an extreme model without DM (dashed line), a fiducial model with DM with Mmin = 10-3M⊙ (dot-dashed line), where Mmin is the mass of the smallest DM subhalo, and a fiducial model with DM with Mmin = 10-6M⊙ (three dots-dashed line). |
| In the text | |
|
Fig. 2 SZE-21 cm (in units of brightness temperature relative to the CMB) for a thermal plasma at temperature kT = 7 keV and with τ = 5 × 10⁻³ (solid line). With the dashed line the standard SZE ΔTst for the same parameters is plotted for comparison. |
| In the text | |
|
Fig. 3 Standard SZE (in units of brightness temperature relative to the CMB) for a thermal plasma (kT = 5 keV and τ = 5 × 10⁻³; solid line) and for a non-thermal plasma (s = 3.5, p1 = 10 and τ = 1 × 10⁻⁴; dashed line). The SZE is shown in the radio frequency range where the 21-cm radiation background are visible. |
| In the text | |
|
Fig. 4 SZE-21 cm (in units of brightness temperature relative to the CMB) for thermal plasma at temperature kT = 5, 10, 15 and 20 keV, shown by the solid, dashed, dot-dashed and dash-three dots lines, respectively. A constant value τ = 5 × 10⁻³ has been used in the calculations. |
| In the text | |
|
Fig. 5 Percentage difference between the relativistic result and the non-relativistic one for the SZE-21 cm for galaxy clusters with temperatures of 20 keV (solid line), 15 keV (dashed line) and 7 keV (dot-dashed line). |
| In the text | |
|
Fig. 6 Difference between the SZE-21 cm and the standard SZE (in units of brightness temperature relative to the CMB) for thermal plasma at temperature kT = 5, 10, 15 and 20 keV, shown by the solid, dashed, do-dashed and dash-three dots lines, respectively, as in Fig. 4. A constant value τ = 5 × 10⁻³ has been used in these calculations. |
| In the text | |
|
Fig. 7 SZE-21 cm (in units of brightness temperature relative to the CMB) for non-thermal electrons with a power-law spectrum with s = 3.5 and p1 = 0.1, 1, 5 and 10, shown by the solid, dashed, dot-dashed and dash-three dots lines, respectively. A constant value τ = 1 × 10⁻⁴ has been used in the calculations. |
| In the text | |
|
Fig. 8 Difference between the SZE-21 cm and the standard SZE (in units of brightness temperature relative to the CMB) for non-thermal electrons with a power-law spectrum with s = 3.5 and p1 = 0.1, 1, 5 and 10, shown by the solid, dashed, dot-dashed and dash-three dots lines, respectively. A constant value τ = 1 × 10⁻⁴ has been used in the calculations. |
| In the text | |
|
Fig. 9 For an illustrative description of the possible redshift-dependence of the overall modified background model, we show the SZE-21 cm (in units of brightness temperature relative to the CMB) for a thermal plasma at temperature kT = 7 keV and with τ = 5 × 10⁻³ for the modified CMB spectrum with the values of z taken from the original model (solid line), and for a modified CMB spectrum in which all components are globally shifted in frequency by a factor 3 (dashed line). |
| In the text | |
|
Fig. 10 SZE-21 cm (in units of brightness temperature relative to the CMB) for a thermal plasma at temperature kT = 5 keV (upper panel) and 20 keV (lower panel) and with τ = 5 × 10⁻³ for a modified CMB spectrum with a fiducial model without DM (solid line), an extreme model without DM (dashed line), a fiducial model with DM with Mmin = 10-3M⊙ (dot-dashed line), and a fiducial model with DM with Mmin = 10-6M⊙ (three dots-dashed line). |
| In the text | |
|
Fig. 11 SZE-21 cm (in units of brightness temperature relative to the CMB) for a non-thermal plasma with s = 3.5 and p1 = 0.1 (upper panel) and 10 (lower panel) and with τ = 1 × 10⁻⁴ for a modified CMB spectrum with a fiducial model without DM (solid line), an extreme model without DM (dashed line), a fiducial model with DM with Mmin = 10-3M⊙ (dot-dashed line), and a fiducial model with DM with Mmin = 10-6M⊙ (three dots-dashed line). |
| In the text | |
|
Fig. 12 SZE-21 cm (in units of brightness temperature relative to the CMB and in absolute value) for a thermal plasma with temperature kT = 20 keV (solid line) and 5 keV (dashed line), and with τ = 5 × 10⁻³, compared with a spectrum similar to that of Coma radio halo (long-dashed line), and with the same spectrum for a Coma-like cluster located at z = 1 (three dots-dashed line). |
| In the text | |
|
Fig. 13 Surface brightness profile of the standard SZE in absolute value for thermal plasma with temperatures kT = 20 (solid line), 15 (dashed), 10 (dot-dashed) and 5 (three dots-dashed) keV, and calculated for τ0 = 5 × 10⁻³, θc = 300 arcesc, β = 0.75, θmax = 10θc. |
| In the text | |
|
Fig. 14 Upper panel: spectra of the fluxes of the SZE-21 cm ΔImod (in units of μJy and in absolute value with the solid lines) and the SZE for a non-modified CMB ΔIst (dashed lines). Lower panel: absolute value of the difference between the SZE-21 cm and the standard SZE for a non-modified CMB. Both panels are using for the modified CMB the fiducial model without DM (solid line in Fig. 1). Both panels are for thermal plasma with temperatures kT = 20 (green), 15 (black), 10 (red) and 5 (cyan) keV, and calculated for τ0 = 5 × 10⁻³, θc = 300 arcesc, β = 0.75, θmax = 10θc, compared with the SKA-50%, SKA1-low, and SKA 2 sensitivities for 100 kHz bandwith, 1000 h of integration, 2 polarizations, no taper, no weight (thick lines). |
| In the text | |
|
Fig. 15 Like Fig. 14 but for an extreme model without DM for the modified CMB (dashed line in Fig. 1). |
| In the text | |
|
Fig. 16 Like Fig. 14 but for a fiducial model with DM with Mmin = 10-3M⊙ for the modified CMB (dot-dashed line in Fig. 1). |
| In the text | |
|
Fig. 17 Like Fig. 14 but for a fiducial model with DM with Mmin = 10-6M⊙ for the modified CMB (three dots-dashed line in Fig. 1). |
| In the text | |
|
Fig. A.1 Spectral analysis of the first model (solid line) of Fig. 1. Upper panel: thermal SZE-21 cm for kT = 7 keV and τ = 5 × 10⁻³ calculated with the relativistic approach (solid line) and the non-relativistic approach (dashed line), compared with the standard SZE calculated with the relativistic approach (long-dashed line) and the non-relativistic approach (dotted line). Middel panel: percentage difference between the relativistic result and the non-relativistic one. Lower panel: second derivative of the input spectrum. |
| In the text | |
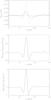 |
Fig. A.2 Same as Fig. A.1 but for the second model (dashed line) of Fig. 1. |
| In the text | |
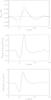 |
Fig. A.3 Same as Fig. A.1 but for the third model (dot-dashed line) of Fig. 1. |
| In the text | |
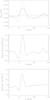 |
Fig. A.4 Same as Fig. A.1 but for the fourth model (three dots-dashed line) of Fig. 1. |
| In the text | |
Current usage metrics show cumulative count of Article Views (full-text article views including HTML views, PDF and ePub downloads, according to the available data) and Abstracts Views on Vision4Press platform.
Data correspond to usage on the plateform after 2015. The current usage metrics is available 48-96 hours after online publication and is updated daily on week days.
Initial download of the metrics may take a while.