| Issue |
A&A
Volume 594, October 2016
|
|
|---|---|---|
| Article Number | A97 | |
| Number of page(s) | 10 | |
| Section | Astrophysical processes | |
| DOI | https://doi.org/10.1051/0004-6361/201628980 | |
| Published online | 18 October 2016 | |
The effect of pair-instability mass loss on black-hole mergers
1 Astronomical Observatory, Warsaw University, Ujazdowskie 4, 00-478 Warsaw, Poland
e-mail: This email address is being protected from spambots. You need JavaScript enabled to view it.
2 Monash Centre for Astrophysics, School of Physics and Astronomy, Monash University, Victoria 3800, Australia
3 School of Physics & Astronomy, University of Minnesota, Minneapolis, MN 55455, USA
4 Center for Nuclear Astrophysics, Department of Physics and Astronomy, Shanghai Jiao-Tong University, Shanghai 200240, PR China
5 Joint Institute for Nuclear Astrophysics, 1 Cyclotron Laboratory, National Superconducting Cyclotron Laboratory, Michigan State University, East Lansing, MI 48824-1321, USA
6 Research School of Astronomy and Astrophysics, The Australian National University, Canberra, ACT 2611, Australia
7 ARC Centre of Excellence for All-sky Astrophysics (CAASTRO), 2006 New south Wales, Australia
8 Department of Astronomy and Astrophysics, University of California, Santa Cruz, CA 95064, USA
9 Enrico Fermi Institute, Department of Physics, Department of Astronomy and Astrophysics, and Kavli Institute for Cosmological Physics, University of Chicago, Chicago, IL 60637, USA
10 Center for Computational Relativity and Gravitation, Rochester Institute of Technology, Rochester, New York 14623, USA
11 CCS-2, MSD409, Los Alamos National Laboratory, Los Alamos, NM 87545, USA
12 Department of Physics and Astronomy, The University of Mississippi, University, MS 38677, USA
13 CENTRA, Departamento de Física, Instituto Superior Técnico, Universidade de Lisboa, Avenida Rovisco Pais 1, 1049 Lisboa, Portugal
Received: 22 May 2016
Accepted: 17 July 2016
Abstract
Context. Mergers of two stellar-origin black holes are a prime source of gravitational waves and are under intensive investigation. One crucial ingredient in their modeling has been neglected: pair-instability pulsation supernovae with associated severe mass loss may suppress the formation of massive black holes, decreasing black-hole-merger rates for the highest black-hole masses.
Aims. We demonstrate the effects of pair-instability pulsation supernovae on merger rate and mass using populations of double black-hole binaries formed through the isolated binary classical evolution channel.
Methods. The mass loss from pair-instability pulsation supernova is estimated based on existing hydrodynamical calculations. This mass loss is incorporated into the StarTrack population synthesis code. StarTrack is used to generate double black-hole populations with and without pair-instability pulsation supernova mass loss.
Results. The mass loss associated with pair-instability pulsation supernovae limits the Population I/II stellar-origin black-hole mass to 50 M⊙, in tension with earlier predictions that the maximum black-hole mass could be as high as 100 M⊙. In our model, neutron stars form with mass 1−2 M⊙. We then encounter the first mass gap at 2−5 M⊙ with the compact object absence due to rapid supernova explosions, followed by the formation of black holes with mass 5−50 M⊙, with a second mass gap at 50−135 M⊙ created by pair-instability pulsation supernovae and by pair-instability supernovae. Finally, black holes with masses above 135 M⊙ may potentially form to arbitrarily high mass limited only by the extent of the initial mass function and the strength of stellar winds. Suppression of double black-hole-merger rates by pair-instability pulsation supernovae is negligible for our evolutionary channel. Our standard evolutionary model, with the inclusion of pair-instability pulsation supernovae and pair-instability supernovae, is fully consistent with the Laser Interferometric Gravitational-wave Observatory (LIGO) observations of black-hole mergers: GW150914, GW151226, and LVT151012. The LIGO results are inconsistent with high (≳ 400 km s-1) black hole (BH) natal kicks. We predict the detection of several, and up to as many as ~60, BH-BH mergers with a total mass of 10−150 M⊙ (most likely range: 20−80 M⊙) in the forthcoming ~60 effective days of the LIGO O2 observations, assuming the detectors reach the optimistic target O2 sensitivity.
Key words: stars: massive / black hole physics / gravitational waves
© ESO, 2016
1. Introduction
In September 2015 the upgraded Laser Interferometer Gravitational-wave Observatory (LIGO) began observations with a sensitivity to the merger of two neutron stars to an average horizon distance of dnsns ≈ 70 Mpc. In this first upgraded science run (O1; Abbott et al. 2016b; The LIGO Scientific Collaboration et al. 2016), LIGO made two firm detections of black hole-black hole (BH-BH) mergers with component masses of 36 M⊙ and 29 M⊙ (GW150914), and 14 M⊙ and 8 M⊙ (GW151226), and also reported a candidate BH-BH merger with masses of 23 M⊙ and 13 M⊙ (LVT151012). These discoveries verified earlier predictions that: (i) the first detection would happen when LIGO sensitivity reaches dnsns = 50−100 Mpc; that (ii) BH-BH mergers would dominate the gravitational-wave signal; and that (iii) the merging black holes would be substantially more massive than typical 10 M⊙ Galactic BHs (Belczynski et al. 2010b; Dominik et al. 2015; Belczynski et al.2016b).
BH-BH mergers have been proposed as potential gravitational wave sources since the 1980s (Bond et al. 1984; Thorne 1987; Schutz 1989) and have been studied since the 1990s (Tutukov & Yungelson 1993; Lipunov et al. 1997; Flanagan & Hughes 1998). More recently, a number of groups have provided evolutionary models leading to potential BH-BH formation in a typical Galactic environment with high metallicity stars (Brown et al. 2001; Nelemans et al. 2001; Belczynski et al. 2002; Voss & Tauris 2003; Postnov & Yungelson 2006). Subsequently it was shown that BH-BH merger formation in the Galactic environment, with its high metallicity, leads to suppression of BH-BH merger formation (Belczynski et al. 2007; Mennekens & Vanbeveren 2014), a finding that was not encountered in previous studies. Only later was it noted that low metallicity stars dominate the formation of massive BHs (Belczynski et al. 2010a) and BH-BH mergers in general (Belczynski et al. 2010b). Full-scale predictions that took into account low metallicity stars were performed in advance of the 2015 LIGO detections (Dominik et al. 2012, 2013, 2015; Rodriguez et al. 2015; Marchant et al. 2016; Belczynski et al. 2016b; Mandel & de Mink 2016).
Additionally, Population III stars have also been considered as possible venues for BH-BH formation and gravitational wave detection for over thirty years (Bond et al. 1984; Belczynski et al. 2004; Kinugawa et al. 2014). Finally, prior to the first BH-BH merger detections, Population I/II very massive stars (> 150 M⊙; Crowther et al. 2010) were also introduced into predictions of BH-BH merger rates (Belczynski et al. 2014; Marchant et al. 2016).
Since the first detection of GW150914, several investigations have examined how double black-hole binaries could have been produced from the evolution of massive stars, whether from classical isolated evolution in low-metallicity environments (Belczynski et al. 2016a; Eldridge & Stanway 2016); via the aid of rapid rotation and hence homogeneous chemical evolution (de Mink & Mandel 2016; Woosley 2016); via Population III stars (Hartwig et al. 2016; Inayoshi et al. 2016; Dvorkin et al. 2016); or from dynamical formation in interacting environments (Mapelli 2016; Rodriguez et al. 2016). Other more exotic scenarios have been introduced and discussed in the context of GW150914; dark matter primordial BH-BH formation (Sasaki et al. 2016; Eroshenko 2016), formation of a BH-BH merger from a divided core of a massive rapidly rotating single star (Loeb 2016), or formation of BH-BH mergers with disks around BHs formed from fallback material in weak supernova explosions (Perna et al. 2016).
In this study we consider the effects of pair-instability pulsation supernovae (PPSN) and pair-instability supernovae (PSN) on BH-BH mergers. PPSN are associated with severe mass loss (Heger & Woosley 2002; Woosley et al. 2007) that may significantly reduce BH mass and thus the detectability of BH-BH mergers. PSN are expected to completely disrupt massive stars with no resulting BH formation (Bond et al. 1984; Fryer et al. 2001; Chatzopoulos & Wheeler 2012a) and thus suppress the formation of BH-BH mergers. While PSN are taken into account in some of the predictions for BH-BH merger formation (e.g., Marchant et al. 2016; Mandel & de Mink 2016; Spera et al. 2016), PPSN and associated mass loss have thus far been ignored in studies of BH-BH formation (e.g., Dominik et al. 2015; Rodriguez et al. 2015, 2016; Belczynski et al. 2016b,a; Marchant et al. 2016; Mandel & de Mink 2016; de Mink & Mandel 2016; Eldridge & Stanway 2016) with the exception of recent work by Woosley 2016. We quantify the effect of PPSN and PSN on BH-BH mergers in our isolated classical binary evolution channel. In brief, these processes introduce a maximum mass of stellar-origin black holes which differs from previous projections, for example, in comparison to the review in Abbott et al. (2016a).
2. Pair-instability: pulsation supernovae and supernovae
Pair-instability pulsation supernovae and pair-instability supernovae are produced in massive stellar cores when the temperature in the inner part of the star becomes sufficiently high (T ≳ 5 × 10⁹K) while the density is still rather low (e.g., oxygen burning) to allow for the production of electron-positron pairs. For not very massive stellar cores, such high temperatures may also be reached during the advanced burning stages; however, then the entropy is lower and the density is higher, blocking the formation of electron–positron pairs. The pair production reduces the photon pressure by converting internal energy into rest mass of the pairs and effectively lowers the equation-of-state γ in the radiation dominated plasma to unstable values (γ< 4/3). This leads to rapid contraction with a small fraction of free-fall acceleration of the inner part of the star, typically within the C/O core. The increase of temperature that follows the collapse leads to very rapid thermonuclear burning that can release energy comparable to, or even in excess of, the binding energy of the star. If enough energy is deposited and a sufficient fraction of the star leaves the regime of pair instability, the contraction can evolve into an expansion that steepens into a shock at the edge of the carbon-oxygen (CO) core. Depending on the amount of deposited energy and momentum transfer, the outer layers may be ejected (pair instability pulsation supernova: PPSN) or the entire star is disrupted (pair instability supernova: PSN). In the latter case, no remnant is left behind. In the former case, even after the first pulse the star may still be massive enough for subsequent and recurrent pulses.
These pair-instability pulsation supernovae and associated mass ejections operate for helium cores with masses MHe ≳ 40−45 M⊙. For helium cores above MHe ≳ 60−65 M⊙ the (non-pulsational) pair instability operates, that is, the first pulse is energetic enough to entirely disrupt the star (Heger & Woosley 2002). For even more massive helium cores MHe ≳ 135 M⊙, the center of the star becomes so hot, that besides burning all the way to nickel, photo-disintegration of heavy elements to alpha particles and then subsequent photo-disintegration of alpha particles decreases photon pressure. This softens the equation of state enough that instead of an explosion, a collapse of the central region leads to the formation of a black hole. The release of thermonuclear energy is not able to overcome the large binding energy of the massive star (Fryer et al. 2001; Heger & Woosley 2002).
These limits are subject to various modeling uncertainties. For example, the most recent calculations (Woosley et al., in prep.) show that pulses may appear already for helium cores with masses as low as MHe ~ 30−40 M⊙. However, these pulsations would not remove significant mass from stars (Mejecta ≲ 1 M⊙). The division between PPSN and PSN is also not clear cut, and helium cores within the mass range MHe ~ 60−65 M⊙ may either experience PPSN or PSN.
The pair-instability pulsation supernovae for helium cores with MHe ~ 45−65 M⊙ can remove significant amounts of mass from stars prior to the core collapse (Mejecta ~ 5−20 M⊙). Beyond model assumptions, the exact amount of mass loss is sensitive to the detailed sequence of pulses and their energies (Woosley & Heger 2015) and therefore may vary discontinuously as a function of initial mass. In general, however, mass loss tends to increase with the helium core mass. Despite the PPSN mass loss, these helium cores are massive enough to form black holes after the final core collapse. The maximum helium star mass after PPSN is likely to be around MHe ~ 45 ± 5 M⊙. For a given helium star mass, at the end of core-helium burning the final outcome will be insensitive to the evolutionary path up to this point and insensitive to the initial metallicity of the progenitor (Woosley 2016).
The above discussion fully applies to the evolution of massive close binaries in which stars get stripped of their H-rich envelopes during Roche Lobe Overflow (RLOF) or common envelope (CE) events independent of their mass or metallicity. However, if stars retain their H-rich envelope (e.g., low metallicity single stars) the pair-instability pulsation supernovae models allow for stars to have masses as high as M ~ 52 M⊙ at the time of core collapse (Woosley et al., in prep.). The same models give the absolute upper limit on the star mass at the time of core collapse in the mass regime in which PPSNe operate: M ~ 70 M⊙. These values are based on a non-rotating stellar model with no wind-mass loss (e.g., POP III star) and with almost no pair-instability pulsation supernovae mass loss (MHe ~ 30 M⊙). This is an important difference from helium star models (binary evolution) that provide only up to approximately 45 M⊙ for black-hole formation, while models that retain H-rich envelopes (single stars) can potentially supply up to 70 M⊙ to form a black hole.
Stars that retain their hydrogen envelope are expected to form black holes with mass up to ~ 50−70 M⊙, and then above ~ 135 M⊙ (if massive stars reach conditions sufficient for the formation of helium cores above 135 M⊙). Stars that become naked helium cores during their evolution are expected to form black holes with mass up to ~ 45 ± 5 M⊙, and then above ~ 135 M⊙. This gap in the mass spectrum of BHs, ~ 50−135 M⊙, is the second mass gap predicted for compact-object formation (Yusof et al. 2013; Belczynski et al. 2014; Marchant et al. 2016). The first mass gap appears between the heaviest neutron stars (NSs) and the lightest BHs: ~ 2−5 M⊙ (Bailyn et al. 1998; Özel et al. 2010). It has been explained either in terms of observational bias on BH mass measurements (Kreidberg et al. 2012), or in the context of the supernova explosion engine (Belczynski et al. 2012), or in terms of the transition of compressible nuclear matter into incompressible quark-superfluid that transforms heavy NSs into dark energy (invisible) objects (Hujeirat 2016).
Most of the work studying pair-instabilities has focused on one-dimensional explosions (Barkat et al. 1967; Bond et al. 1984; Woosley et al. 2007; Heger & Woosley 2002; Chatzopoulos & Wheeler 2012a,b). Given the turbulent nature of this runaway burning, it is not surprising that there are some differences between these one -dimensional models and recent two -dimensional results (Chatzopoulos et al. 2013; Chen et al. 2014). However, these differences are small and insignificant for the purpose of this paper. Much more work remains to be done to understand the exact nature of these explosive events. Observations of BH-BH mergers with heavy black holes will impose very useful constraints on pair-instability models.
3. Model
Population synthesis calculations were performed with the StarTrack code (Belczynski et al. 2002, 2008). Recently we updated this code with improved physics. The improvements relevant for massive star evolution include updates to the treatment of CE evolution (Dominik et al. 2012), the compact object masses produced by core collapse/supernovae (Fryer et al. 2012; Belczynski et al. 2012), stellar binary initial conditions set by observations (de Mink & Belczynski 2015), and observationally constrained star formation and metallicity evolution over cosmic time (Belczynski et al. 2016a).
In particular, our calculations employ analytic fits to non-rotating stellar models presented by Hurley et al. (2000). More advanced stellar models are now available (e.g. Chen et al. 2015) and some include effects of rotation on stellar evolution (Georgy et al. 2013; Choi et al. 2016). We do not directly use any of these updated stellar models. However, we updated the original Hurley et al. (2000) models with revised stellar wind prescriptions (Vink 2011) and with a new compact-object formation scheme (Fryer et al. 2012), and we have begun calibrating our evolution with the calculations performed with these most modern stellar models (Pavlovskii et al. 2016). Treatment of convection, mixing, stellar rotation, and winds differs from code to code resulting in different stellar core mass for the same star. These uncertainties impose limitations to any study performed with the results of stellar evolutionary calculations. In particular, we use the helium core mass to judge the development of pair-instability and carbon-oxygen core mass to calculate neutron star and black-hole mass (see below). To quantify uncertainties that originate from details of stellar modeling, it would be necessary to repeat our calculations with a different population synthesis code that employs different stellar models than those used here. Such codes already exist, for example Spera et al. (2015), Marchant et al. (2016), Eldridge & Stanway (2016) and hopefully they will be used in the near future to test and challenge our current predictions.
Initial parameters for massive binary stars (progenitors of neutron stars and black holes; MZAMS ≳ 7−10 M⊙) are guided by recent observations of O/B binaries (Sana et al. 2012; Kobulnicky et al. 2014). The primary mass is chosen from a three-component broken power-law initial mass function with a rather flat power-law exponent for massive stars (αIMF = −2.3). A flat mass ratio distribution is used to calculate the secondary mass and binaries are assumed to form predominantly on close (∝ (log Porb)-0.5) and rather circular orbits (∝ e-0.42). We assume that binarity for massive stars (> 10 M⊙) is 100% and 50% for less massive stars. Our stars are assumed to only moderately rotate (200−300 km s-1). We do not consider the small fraction of massive stars that may rotate at very high speeds (~ 600 km s-1). For such rapidly rotating stars the effects of rotation on their evolution need to be included in evolutionary calculations (Marchant et al. 2016; de Mink & Mandel 2016; Eldridge & Stanway 2016). As reported, the stellar models used in our study do not include effects of rotation on the evolution of stars. However, we include the effect of rotation in estimates of tidal interactions between both stars and the binary orbit. Stellar spins (and thus binary orbit) are further affected due to magnetic braking for stars with significant convective envelopes. Additionally, we calculate orbital changes due to stellar-wind mass loss (Jeans mode mass loss: orbital expansion) and angular momentum loss due to emission of gravitational waves (important only for very compact binaries). The development and (dynamical) stability of RLOF is judged based on the following: binary mass ratio, evolutionary stage of the donor, response to mass loss, and behavior of the orbital separation in response to mass transfer and angular momentum loss (Belczynski et al. 2008). During stable RLOF, we assume that half of the mass is accreted onto the companion, while the other half is lost from the binary with the specific angular momentum; we adopt rather effective angular momentum loss with jloss = 1.0 defined in Podsiadlowski et al. (1992). Unstable mass transfer is assumed to lead to CE. CE is treated using the energy balance formalism with fully effective conversion of orbital energy into envelope ejection (α = 1.0), while the envelope binding energy is obtained with the parameter λ which depends on donor mass, radius, and metallicity. A typical value of this parameter is: λ ≈ 0.1 for massive stars Xu & Li (2010). During CE neutron stars and black holes accrete at 10% Bondi-Hoyle rate (Ricker & Taam 2008; MacLeod & Ramirez-Ruiz 2015). Supernova explosions affect the binary orbit; we allow for mass loss, neutrino loss and natal kicks during explosions. In particular, for specific configurations a given binary may be disrupted and two stars are then evolved in isolation.
In this study, we add to the StarTrack code a model for mass loss associated with pair-instability pulsation supernovae and we incorporate new input physics that allow for pair-instability supernovae. We will refer to this input physics as the M10 model (based on the discussion presented in Sect. 2). Our standard input physics without PPSN/PSN will be referred to as model M1 (as in Belczynski et al. 2016a). Our basic assumptions in compact object mass calculations apply to both models, M1 and M10. However, in model M10 we impose one extra constraint on BH mass. The details for both models are given below.
Each compact object mass is estimated based on a selection of hydrodynamical supernova models that are initiated with stellar models obtained with detailed evolutionary calculations (Woosley et al. 2002; Heger et al. 2003; Fryer 2006; Limongi & Chieffi 2006; Dessart et al. 2007; Poelarends et al. 2008; Young et al. 2009). The final prescriptions for compact object mass are based on the mass of a star at the time of core collapse and the final mass of its carbon-oxygen core (Fryer et al. 2012). In this study we employ a prescription that reproduces the observed mass gap between neutron stars and black holes with rapid supernova explosions (Belczynski et al. 2012). Neutron stars are formed with masses in the range 1.1−2.5 M⊙, while black holes form with masses in the range 5−94 M⊙ and the upper limit on a black-hole mass is set by stellar winds and their dependence on metallicity (Belczynski et al. 2010a). For single stars our formulation results in a strict limit between neutron stars and black holes in terms of the Zero Age Main Sequence mass (MZAMS) of the compact object progenitor. For solar metallicity (Z = 0.02) this limit is found at MZAMS ≈ 20 M⊙ and it changes with the metallicity of the progenitor. This prescription has been designed to reproduce observations of compact objects. More pertinently, our standard model with and without pair instability supernovae reproduces the masses and event rates of LIGO observations (see Sect. 5).
Some recent hydrodynamical simulations of core collapse seem to indicate that even for single stars (initial mass range MZAMS ≈ 15−40 M⊙), one may expect non-monotonic behavior in neutron-star and black-hole formation (O’Connor & Ott 2011; Ertl et al. 2016). These conclusions reflect violent, chaotic behavior that impacts the final collapsing core and hence remnant mass. Although Fryer et al. (2012) found similar behavior, the exact results depend sensitively on the stellar evolution code used to produce the progenitor. Our prescription uses the smoothed fit from Fryer et al. (2012). Fryer (2014) provides a review of the different methods to determine compact remnant masses and their similarities.
Introducing a chaotic single star initial-remnant mass relationship would not influence our predictions for the most massive stars, including the focus of this work (pair-instability pulsations supernovae) and our predictions for events like GW150914 (36 + 29 M⊙ BH-BH merger). On the other hand, however, adding a chaotic mechanism would decrease the number of lower-mass BH-BH mergers formed from stars with masses MZAMS< 40 M⊙. In particular, the detection rate of BHs with low mass like GW151226 (14 + 8 M⊙ BH-BH merger) would be reduced.
Finally, we note that our model already incorporates non-deterministic elements in binary evolution that create comparable effects to chaos and significantly impacts the range of initial star masses that can form BHs. For example, even stars as massive as 100 M⊙ may form NSs in some specific binary configurations, while in other binary configurations they will form BHs (Belczynski & Taam 2008). In other words, our simulations include non-monotonic formation of NSs and BHs with respect to progenitor initial mass, with NSs and BHs mixed up in a wide range of initial masses (MZAMS ≈ 10−100 M⊙) in our binary star simulations.
In model M10 we assume that stars that form helium cores in the mass range MHe = 45−65 M⊙ are subject to PPSN and they lose all the mass above the central 45 M⊙ just prior to core collapse. This includes the entire H-rich envelope (if a given star has retained one), or it means losing outer He-rich and possibly C/O-rich layers from a Wolf-Rayet star. The remaining star is then assumed to directly collapse to a BH (Fryer et al. 2012). We only allow for mass loss via neutrino emission:  (1)The BH mass is mostly set by the PPSN threshold. However, it should be remembered that this threshold is subject to a number of modeling uncertainties and most likely it is not a sharp cutoff but rather a transition region centered around this threshold value (MHe ≈ 45 ± 5 M⊙; see Sect. 2). We do not introduce this PPSN threshold uncertainties on our Eq. (1), but we take them into account while reporting our final results (e.g., maximum mass from the above equation is 50 M⊙ if these uncertainties are taken into account). The amount of neutrinos that can escape (fn) during massive BH formation is highly uncertain. Neutrino mass losses during NS formation are at the level of fn = 0.1 (Lattimer & Yahil 1989; Timmes et al. 1996). However, one may expect that during BH formation some neutrinos are trapped under the BH horizon fn< 0.1. In this study we adopt fn = 0.1 neutrino mass loss for BH formation. This generates MBH = 40.5 M⊙ from stars subjected to PPSN mass loss. Had we assumed fn = 0.01, that would result in MBH = 44.6 M⊙ from stars subjected to PPSN mass loss. We note that we additionally assume that the fraction of BH mass lost in neutrinos is independent of BH mass.
The mass of a BH given by Eq. (1) indicates maximum BH mass for BH formation out of naked helium stars. For no neutrino mass loss and the high-end of PPSN threshold it is MBH = 50 M⊙. This applies to the formation of BH-BH mergers in isolation whether via the classical or homogeneous evolution channel. It is possible that at low metallicity (≲ 1% Z⊙) a single star with a helium core mass just below the PPSN threshold retains some of its H-rich envelope. In such a case, the BH can reach a mass higher than that given by Eq. (1) (see Sect. 4 for details).
Also in model M10 we assume that stars that form helium cores in the mass range MHe = 65−135 M⊙ are subject to PSN. In such cases, we assume that the entire star is disrupted and no remnant forms (neither NS nor BH).
We also consider an extra model that differs from model M1 by only one parameter. In model M3 we subject all compact objects (both neutron stars and black holes) to high natal kicks. These kicks are adopted from the natal-kick distribution measured for single pulsars in our Galaxy (Hobbs et al. 2005); the natal kicks are drawn from a 1D Maxwellian with σ = 265 km s-1 (average 3D speed of ~ 400 km s-1). In other models (M1 and M10), compact objects that experience fall back during the formation receive a decreased kick (inversely proportional to the amount of fall back). For the most massive BHs (full fall back) there is no natal kick. However, even heavy NSs receive reduced natal kicks as there is some fall back expected at their formation (Fryer et al. 2012). This assumption about compact-object natal kicks leads to a severe reduction of BH-BH merger rates, moderate reduction of BH-NS merger rates, and small reduction of NS-NS merger rates; we consider it our pessimistic model (Belczynski et al. 2016a).
Our population synthesis data are set in a cosmic framework. The merger rate densities of double compact objects are obtained as a function of redshift, and the merger properties as a function of the type of merger, its mass, and its origin (Belczynski et al. 2016b).
For the cosmic star-formation rate (SFR) we adopt a formula from the recent study of Madau & Dickinson (2014): ![Mathematical equation: \begin{equation} {\it SFR}(z)=0.015 {(1+z)^{2.7} \over 1+[(1+z)/2.9]^{5.6}} \,\msun \, {\rm Mpc}^{-3}\, {\rm yr}^{-1}. \label{sfr} \end{equation}](/articles/aa/full_html/2016/10/aa28980-16/aa28980-16-eq87.png) (2)SFR is well established at low redshifts (z< 2), however, there is a lot of uncertainty at higher redshifts (reddening and scarcity of good observational constraints). Our adopted SFR results in very low star-formation rates for z> 2. This formula may be treated as a proxy for the lower bound on SFR at high redshifts. It is possible that the type of analysis used by Madau & Dickinson (2014) does not fully correct for the small galaxies not seen in UV surveys; the predicted high-redshift SFR cannot reionize the Universe with stars and it underpredicts the observed GRB rate (Kistler et al. 2009; Horiuchi et al. 2011; Mitchell-Wynne et al. 2015). Any increase of SFR would result in an increase of our double compact object merger rates. In Fig. 1 we show the SFR adopted in our study from Madau & Dickinson (2014) in comparison with the very high SFR from a different study (Strolger et al. 2004). Most likely, the actual high-redshift SFR would be found somewhere between these two models.
(2)SFR is well established at low redshifts (z< 2), however, there is a lot of uncertainty at higher redshifts (reddening and scarcity of good observational constraints). Our adopted SFR results in very low star-formation rates for z> 2. This formula may be treated as a proxy for the lower bound on SFR at high redshifts. It is possible that the type of analysis used by Madau & Dickinson (2014) does not fully correct for the small galaxies not seen in UV surveys; the predicted high-redshift SFR cannot reionize the Universe with stars and it underpredicts the observed GRB rate (Kistler et al. 2009; Horiuchi et al. 2011; Mitchell-Wynne et al. 2015). Any increase of SFR would result in an increase of our double compact object merger rates. In Fig. 1 we show the SFR adopted in our study from Madau & Dickinson (2014) in comparison with the very high SFR from a different study (Strolger et al. 2004). Most likely, the actual high-redshift SFR would be found somewhere between these two models.
We adopt the mean metallicity evolution model from Madau & Dickinson (2014), and we modify it to:  (3)with a return fraction of R = 0.27 (mass fraction of stars put back into the interstellar medium), a net metal yield of y = 0.019 (mass of metals ejected into the medium by stars per unit mass locked in stars), a baryon density of
  with Ωb = 0.045 and h0 = 0.7, a SFR from Eq. (2), and
  with ΩΛ = 0.7, ΩM = 0.3, Ωk = 0, and H0 = 70.0 km s-1 Mpc-1. In our modification we have increased the mean level of metallicity by 0.5 dex to be in a better agreement with observational data (Vangioni et al. 2015). We assume a log–normal distribution of metallicity around the mean at each redshift, and we adopt σ = 0.5 dex from Dvorkin et al. (2015). The graphic presentation of our adopted model is given in Extended Data Fig. 6 of Belczynski et al. (2016a). The formation of BH-BH mergers is very sensitive to metallicity (Belczynski et al. 2010b; Dominik et al. 2013; de Mink & Belczynski 2015); the rise or drop of the mean level of metallicity will cause the decrease or increase in BH-BH merger rates, respectively. As more stringent constraints appear on SFR and metallicity evolution, we will incorporate them into our modeling and test the influence of associated uncertainties on double compact object merger rates.
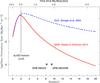 |
Fig. 1 Star-formation rate (SFR) as a function of redshift and cosmic time. The blue dashed line shows the SFR used in our previous studies, while the red line indicates the most recent update (used in this study). We note that for high redshifts (z> 2) the updated SFR generates less stars, and thus reduces formation rates of BH-BH progenitors. We marked the two highest redshift GRBs. Since GRBs form from stars or stellar remnant mergers, their positions mark the lower limit on the beginning of star formation. We also mark the detection horizon for the full advanced LIGO design sensitivity. We assume that Population II and I stars (considered in this study) form at redshifts z< 15. |
For each merger we model the full inspiral-merger-ringdown waveform using the IMRPhenomD gravitational waveform templates (Khan et al. 2016; Husa et al. 2016). We have repeated our calculations with IMRPhenomC waveforms and detection rates of double compact objects are within 10% of these obtained with the IMRPhenomD waveform family. A merger is considered a detection if the signal-to-noise ratio in a single detector is above a threshold equal to eight. This is a simple proxy for detectability by a detector network. We estimate detection rates as described in Belczynski et al. (2016b). For increased accuracy with respect to Belczynski et al. (2016b), where we used an analytic fit (Eq. (12) of Dominik et al. 2015) to the cumulative distribution function describing the detector response, here we interpolate the numerical data for the cumulative distribution function available online1. This improvement leads to a small increase (~few per cent) of detection rates with respect to previous work (Belczynski et al. 2016b,a).
4. Mass of single BHs and BH-BH mergers
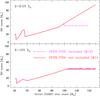 |
Fig. 2 Initial-final mass relation for single stars. Models with (M10) and without (M1) pair-instability pulsation supernovae and pair-instability supernovae are shown. Bottom panel: at high metallicity (Z = 10% Z⊙ and higher) the models are indistinguishable. For the border-line metallicity of Z = 10% Z⊙, stars with very high initial mass (Mzams> 100 M⊙) will form slightly lighter BHs (by ~ 2 M⊙) if pair-instability pulsation supernovae are included. Top panel: at low metallicity (e.g., Z = 0.5% Z⊙) pair-instability pulsation supernovae and pair-instability supernovae do not allow for high mass BH formation; maximum BH mass is MBH = 45 M⊙. For the very low metallicity of Z = 0.5% Z⊙, very massive stars (Mzams ≈ 100−140 M⊙) lose significant mass in pair-instability pulsation supernovae reducing the BH mass to MBH ≈ 40 M⊙, while the most massive stars (Mzams> 140 M⊙) explode in pair-instability supernovae leaving no remnant. |
 |
Fig. 3 Total intrinsic (not weighted by merger rate or by detection probability) merger-mass distribution for two progenitor stellar populations of different metallicity. Models with (M10) and without (M1) pair-instability pulsation supernovae and pair-instability supernovae are shown. Bottom panel: at high metallicity, (Z = 10% Z⊙ and higher) models are indistinguishable. Top panel: at low metallicity (e.g., Z = 0.5% Z⊙), pair-instability pulsation supernovae and pair-instability supernovae do not allow for high mass-merger formation (Mtot ≲ 80 M⊙). We note that the model that does not take into account pair-instability pulsation supernovae and pair-instability supernovae allows for the formation of high mass mergers (Mtot> 80 M⊙). |
The mass spectrum of single BHs remains unaffected by PPSN/PSN for progenitor stars with metallicity higher than Z> 10% Z⊙ (Z⊙ = 0.02: solar metallicity; Villante et al. 2014). This is because stars at high metallicity are subject to intensive stellar-wind mass loss (Vink 2011) and they do not form helium cores above 45 M⊙ (see Fig. 2).
However, in the metallicity range Z = 1−10% Z⊙, the mass spectrum of BHs remains unaffected by PSN but is affected by PPSN. Stars that form within the initial mass range Mzams ≈ 100−150 M⊙ form BHs with the upper limit of their mass set by PPSN mass loss: MBH = 40.5 M⊙ (see Fig. 2).
For the lowest metallicities considered in our study, Z = 0.5−1% Z⊙, the most massive stars are affected both by PPSN and PSN. Stars in the mass range Mzams ≈ 20−100 M⊙ are affected neither by PPSN nor by PSN and they form a wide range of BH masses. The highest mass of a BH is MBH = 45 M⊙ and it is formed by a star with initial mass Mzams ≈ 100 M⊙ that at the time of core collapse has a total mass of 50 M⊙: 5 M⊙ of H-rich envelope and 45 M⊙ core (with the top 10 M⊙ being He-rich, while the deeper layers consist of heavier elements). If neutrino mass loss in core collapse is not as effective as we have assumed (10% mass loss), then the maximum BH mass would be MBH = 50 M⊙ (0% neutrino mass loss). Stars in the initial mass range Mzams ≈ 100−140 M⊙ form BHs with mass set by PPSN mass loss of MBH = 40.5 M⊙, while stars in the mass range Mzams ≈ 140−150 M⊙ are disrupted by PSN and they leave no remnant (see Fig. 2).
Here we note an important caveat. The maximum mass of a BH formed by a single star in our simulations is 50 M⊙ as reported above. However, our simulations are performed for a limited metallicity range (Z = 0.03−0.0001 or Z = 0.5−150% Z⊙). Had we extended the metallicity range down to Population III stars (Z ≈ 0) then the maximum BH mass from single stellar evolution could be higher. Stellar winds for Population III stars are expected to be very weak and these stars may retain most of their H-rich envelope. If our Mzams ≈ 100 M⊙ model retained the entire H-rich envelope and if it still had formed an He core below PPSN threshold, then this star could have potentially formed a 100 M⊙ BH (no neutrino loss and no supernova mass loss). Most likely the mass of the He core of such a star would be above the PPSN threshold due to increased central temperature, but this sets an upper limit on the maximum BH mass for single stars. If Population III stars rotate rapidly (no angular momentum loss with stellar winds), then they form cores that are more massive than predicted in our simulations of Population I and II stars. Therefore, the maximum BH mass for single stars of very low metallicity (Z< 0.0001) is expected to be somewhere in the range 50−100 M⊙. In the case of rapid rotation when the entire star is transformed into an He-rich object at the end of the main sequence (homogeneous evolution), the maximum BH mass is ~ 50 M⊙ even for very low or even zero metallicity. For slow rotators, the maximum BH mass is most likely to be closer to ~ 100 M⊙. This rather complex picture is simplified in the case of binary evolution leading to the formation of BH-BH mergers in isolation (no dynamical interactions). In the case of classical evolution performed in this study, the formation of massive BH-BH mergers is always preceded by both stars being stripped of their H-rich envelope during progenitor binary evolution (Belczynski et al. 2016a). In the case of homogeneous evolution (also field binaries), the progenitor stars burn all the H-rich envelope into an He core (Marchant et al. 2016; de Mink & Mandel 2016). In both cases, the maximum (individual) BH mass in the BH-BH merger is set by Eq. (1), and, depending on the assumption on neutrino losses, it is found to be at ~ 40−45 M⊙ (see below).
Intrinsic double compact object total merger mass is demonstrated in Fig. 3. We define double compact object intrinsic total merger mass as the total binary mass Mtot = M1 + M2 in the source frame where M1 and M2 are two compact object masses. This figure shows BH-BH, BH-NS, and NS-NS mergers formed out of a population of the same number of isolated massive binaries for two metallicities (Z = 10% Z⊙ and Z = 1% Z⊙) in our classical evolutionary scenario. Only binaries with a merger time shorter than the Hubble time (13.7 Gyr) are shown.
At high metallicity Z ≳ 10% Z⊙, the BH-BH merger mass is not affected by the new input physics. This is the result of high wind mass loss at high metallicity, and massive stars are not subjected to either PPSN or PSN, thus the mass spectrum is unchanged.
At lower metallicities, stars can undergo PPSN or PSN, with noticeable influence on the merger mass distribution. Due to PPSN, no black-hole binaries with a total mass above Mtot ~ 80 M⊙ form or merge, producing a sharp cutoff in the mass distribution of coalescing BH-BH binaries. Moreover, due to PPSN, black holes which in M1 would have formed from helium cores with masses 45 <Mhe< 135 M⊙ have in M10 a prescribed (and lower) final black-hole mass. In particular, two massive stars subjected to PPSN will have a total merger mass of Mtot ~ 80 M⊙ and this produces a strong abundance of BH-BH mergers just below the cutoff. BHs that disappear due to PSN in M10, would have mass MBH> 80 M⊙ in model M1. Since these BHs form only at very low metallicities (Z ≲ 0.5% Z⊙) and since they form only from very massive stars (Mzams> 140 M⊙) there are so few of them that their impact on our predictions is negligible.
We do not consider stars above Mzams> 150 M⊙ in this study. Such massive stars exist (Crowther et al. 2010) and were already considered in terms of BH formation (Yusof et al. 2013) and as progenitors of massive BH-BH mergers (Belczynski et al. 2014; Marchant et al. 2016).
5. BH-BH merger and detection rates
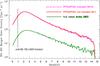 |
Fig. 4 Source frame merger-rate density for BH-BH binaries. We note that there is virtually no change of the rate at any redshift for models with (M10) and without (M1) pair-instability pulsation supernovae and pair-instability supernovae. For reference, we plotted the horizon distance for our most massive BH-BH merger in model M10 (Mtot ≈ 80 M⊙; see Fig. 3). We also show our pessimistic model with high natal kicks (M3). |
The results and discussion in Sect. 4 indicate that PPSN play an important role for stars at low metallicity, but no role for stars in near-solar-metallicity environments. To assess the overall impact of PPSN, we need to account for the heterogeneous and time-varying universe, by convolving the results of our previous analysis with a model for cosmic metal enrichment and star-formation evolution. Specifically, at each cosmic time we sample the evolution of stars with a broad spectrum of metallicities specific to this given time (Belczynski et al. 2016a). Double compact objects that are formed out of stars from each cosmic time are propagated forward in time (delay caused by stellar evolution and time to merger) and their merger times (and corresponding merger redshifts) are recorded.
In Fig. 4 we show the BH-BH merger-rate density as a function of redshift for our two models, one with (M10) and one without (M1) PPSN/PSN included. We note that both models are indistinguishable based on merger-rate density alone. We also note that both models are consistent with the LIGO estimate of the local BH-BH merger-rate density of 9−240 Gpc-3 yr-1 (Abbott et al. 2016b; The LIGO Scientific Collaboration et al. 2016). This LIGO estimate was based on the first two detections (GW150914 and GW151226) and the next loudest event (LVT151012) found in the O1 data. Our local source frame BH-BH merger-rate density is RBHBH ≈ 220 Gpc-3 yr-1 (z< 0.1), and RBHBH ≈ 250 Gpc-3 yr-1 (z< 0.2) for both models. The predicted BH-BH merger-rate density first increases with redshift (by a factor of ~ 10 from z = 0 to z = 2), and then decreases with redshift. This behavior closely resembles the star-formation-rate history (Madau & Dickinson 2014), and reflects the fact that the BH-BH merger-delay time distribution follows a power-law  (Dominik et al. 2012; Belczynski et al. 2016a). We also show (Fig. 4) our pessimistic model with high compact-object natal kicks (M3). The local merger-rate density is rather low: RBHBH ≈ 7 Gpc-3 yr-1 (z< 0.1). Within the framework of our model assumptions and simplifications (see Sect. 3) this model is in tension with the LIGO estimate. This statement is subject to degeneracy with other thus far untested model parameters that could potentially increase the BH-BH merger-rate density. For example, an increase in the SFR at high redshifts (z> 2) with respect to our adopted model (which is hard to exclude due to rather weak observational constraints) could potentially bring the high kick model back into agreement with the LIGO estimate. We plan to present a detailed study of this and other similar degeneracies when more stringent rate constraints appear from LIGO’s next observation run (O2) in 2017. At the moment it seems that full natal kicks (adopted in M3; see Sect. 3) for black holes and heavy neutron stars are not supported by the LIGO data.
Figure 5 shows the total redshifted (observer frame) mass (Mtot,z = Mtot(1 + z)) distribution of NS-NS, BH-NS, and BH-BH mergers within the LIGO reach of the projected O2 scientific run with a NS-NS average detection distance of dnsns = 120 Mpc. The detection distance corresponds to the optimistic O2 target sensitivity described by The LIGO Scientific Collaboration et al. (2013). For comparison, O1 observations were sensitive only to dnsns = 70 Mpc. We have assumed that the O2 run will last six months, and will produce 65 days of coincident data (duty cycle p = 0.36 of two LIGO detectors observing simultaneously). We have adopted a fiducial O2 noise curve (“mid-high”) from The LIGO Scientific Collaboration et al. (2013). We show both of our models and contrast them with the fiducial estimate of the sensitivity of the O2 run (O2 expected upper limits). In mass bins where our models are above the upper limits (Mtot,z = 14−150 M⊙) we predict the most likely detections, and detections are less likely in mass bins in which our models are significantly below the upper limits (Mtot,z< 14 M⊙ for NS-NS mergers and most BH-NS mergers, and Mtot,z> 150 M⊙ for the heaviest and most redshifted BH-BH mergers). The most likely detections are expected in three mass bins that exceed O2 upper limits by the highest factors: Mtot,z = 25−73 M⊙.
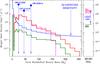 |
Fig. 5 Left panel: observer frame (redshifted) total merger mass distribution for our models: with (M10; magenta broken line) and without (M1; red solid line) pair-instability pulsation supernovae and pair-instability supernovae included. The fiducial O2 LIGO upper limits are marked; the most likely detections are expected when our models are above these upper limits. We note that both models are hardly distinguishable by total merger mass with O2 observations, despite the fact that more massive BH-BH mergers are produced in model M1. The two detections and the next loudest gravitational-wave event from LIGO O1 observations (The LIGO Scientific Collaboration et al. 2016) are marked: GW150914 (36 + 29 M⊙ BH-BH merger at z ≈ 0.1), GW151226 (14 + 8 M⊙ BH-BH merger at z ≈ 0.1), and LVT151012 (23 + 13 M⊙ BH-BH merger at z ≈ 0.2). Right panel: source frame BH-BH merger-rate density for the local Universe. The local source frame BH-BH merger-rate density estimated by LIGO from the O1 run: 9−240 Gpc-3 yr-1 (range marked with blue arrows) may be compared to our local (z< 0.1) source frame rate of RBHBH ≈ 220 Gpc-3 yr-1 (M1 and M10 models). Both model rate densities are almost the same and are within the LIGO estimate. We additionally show the results for our pessimistic model (M3) with high natal kicks: RBHBH ≈ 7 Gpc-3 yr-1 (just below the LIGO allowed range). |
In Table 1 we list local (within redshift of z< 0.1) merger-rate densities, as well as predicted O2 detection rates (RO2 yr-1). The detection rate is easily transformed into a number of expected detection events in the O2 observational run (e.g., assuming 65 effective O2 observation days): Rdet = (65/365)RO2. We find that for our standard evolutionary model, whether or not we include pair-instability pulsation supernovae (with the associated mass loss) and pair-instability supernovae (with the total disruption of BH progenitors), BH-BH mergers will dominate the gravitational wave detections. In particular, we expect about 60 BH-BH merger detections in the O2 run for our standard evolutionary assumptions (about one per day of coincident observations of two LIGO detectors). The prediction is significantly lower for our pessimistic model M3; only about two. BH-BH merger detections in the entire O2 run. Since model M3 is already below the LIGO empirical estimate we expect more detections than predicted in this model, and thus ≳ two detections.
In the mass regime in which we predict detections, both models (M1 and M10) are almost indistinguishable (Fig. 5). Only at very high total BH-BH merger mass (Mtot,z> 150 M⊙) are the two models visibly different; the model with PPSN/PSN (M10) does not extend to as high a total merger mass as the model that does not include PPSN/PSN (M1). The mass range in which the two models differ significantly is not likely to be deeply probed with the LIGO O2 observations. The number of expected detections in the entire O2 run is 3.5 and 1.5 for a total redshifted merger mass of Mtot,z> 145 M⊙ and > 163 M⊙, respectively, for model M1, while it is 0.2 and 0 for Mtot,z> 145 M⊙ and > 163 M⊙, respectively, for model M10. This is not a significant difference, especially if the uncertainties on the maximum mass of a black hole are taken into account (see Sect. 2). However, since the sensitivity of LIGO during the O2 observations is already projected to be on the verge of distinguishing the two models, it seems likely that the fully-advanced design sensitivity will provide useful constraints on PPSN mass loss.
Merger rate densities and detection rates for LIGO O2 run.
6. Conclusions
We have incorporated pair-instability pulsation supernovae and pair-instability supernovae into predictions of double compact object merger rates and masses in context of near future LIGO observations. We find that:
-
The mass of Population I/II stellar-origin black holes is limited to 50 M⊙ by severe mass loss imposed by pair-instability pulsation supernovae (see Fig. 2). This may be contrasted with earlier predictions that the maximum mass of black holes can reach 80−130 M⊙ in the evolution of Population I/II stars with modest initial masses of Mzams< 150 M⊙ (Zampieri & Roberts 2009; Mapelli et al. 2009; Belczynski et al. 2010a; Spera et al. 2015, 2016). This conclusion applies to black holes formed below the second mass gap (no compact objects in the mass range: 50−135 M⊙; see Sect. 2) imposed by pair-instability pulsation supernovae and pair-instability supernovae. If stars reach high enough mass to avoid disruption by pair-instability supernovae (i.e., if they can form helium cores above 135 M⊙) then black holes with mass above 135 M⊙ may form. Such massive black-hole formation would require any combination of very high star mass > 200−300 M⊙ (whether it is initial mass or mass of a stellar merger), very low metallicity (e.g., Population III stars), or very rapid rotation (homogeneous evolution).
-
We show that the introduction of pair-instability pulsation supernovae and the associated mass loss does not affect our predictions for detection of NS-NS, BH-NS, and BH-BH mergers during the LIGO O2 observational run. In particular, our isolated binary classical evolution channel produces a similar number of detections for the O2 run whether or not pair-instability pulsation supernovae and pair-instability supernovae are included; approximately 60 BH-BH merger detections with a total redshifted mass in the range 10−150 M⊙. Detections of BH-NS and NS-NS mergers originating from our classical isolated binary evolution model are not very likely in O2 (see Table 1). We also note that the detection rates may be significantly smaller if pessimistic assumptions on binary evolution are adopted (i.e., model M3). To demonstrate this we have allowed for high black-hole and neutron-star natal kicks. Under such assumption only about two BH-BH merger detections are predicted in the entire O2 run. Since this model is just below the current LIGO empirical BH-BH merger-rate estimate, it may serve as a lower limit on the number of predicted detections during O2. However, we note that we use the optimistic target O2 sensitivity in all our predictions.
-
The detection of very massive BH-BH mergers (Mtot,z> 150−200 M⊙; see Fig. 5) could distinguish between models with and without pair-instability pulsation supernovae and pair-instability supernovae. However, our results argue that such a detection is unlikely. A detection of any binary with a BH mass MBH> 50 M⊙ will rule out our adopted model for mass loss by pair-instability pulsation supernovae. Such an observation would require reconsideration of the physics currently believed to be driving pair-instability pulsation supernovae and pair-instability supernovae (see Sect. 2). An alternate solution for the detection of a massive BH (MBH> 50 M⊙) is that the massive BH was formed through dynamical interactions. Any dynamical interaction that increases BH mass (either the merger of two BHs or rapid accretion onto a BH in tidal disruption event) can potentially accomplish this. For example, the merger of two lighter BHs (first burst of gravitational waves) may form a massive BH. This massive BH can then undergo a dynamical capture or exchange in a dense stellar environment (e.g., in a globular cluster) placing it in a new, massive binary. This binary generates the second BH-BH merger, in which one BH is very massive. In this scenario, the capture or exchange rate may be limited by the first merger natal kick that could potentially remove the massive BH from a cluster environment (Giersz et al. 2015). There is so far no published probability or rate estimate for such a specific scenario.
Acknowledgments
We would like to thank Sung-Chul Yoon, Mirek Giersz, and John Beacom for very useful discussions on the subject of this study. We would like to thank thousands of Universe@home users that have provided their personal computers and phones for our simulations, and in particular to Krzysztof Piszczek (program IT manager). K.B. acknowledges support from the NCN grant Sonata Bis 2 (Dec-2012/07/E/ST9/01360) and the NCN grant OPUS (2015/19/B/ST9/01099). AJR is funded by the Australian Research Council Centre of Excellence for All-sky Astrophysics (CAASTRO) through Grant No. CE110001020. K.B. is thankful for support from CAASTRO and the Stromlo Distinguished Visitor Program at the Research School of Astronomy and Astrophysics, Australian National University, Canberra. A.H. acknowledges support by the Australian Research Council through an ARC Future Fellowship FT120100363 and by the US National Science Foundation under Grant No. PHY-1430152 (JINA Center for the Evolution of the Elements). T.B. is grateful for support by the NCN grant UMO-2014/15/Z/ST9/00038. R.O. acknowledges support from Grants: NSF PHY 1505629 and (via subcontract) AST 1412449. D.E.H. was supported by NSF CAREER grant PHY-1151836. He also acknowledges support from the Kavli Institute for Cosmological Physics at the University of Chicago through NSF grant PHY-1125897 as well as an endowment from the Kavli Foundation. E.B. was supported by NSF CAREER grant PHY-1055103 and by FCT contract IF/00797/2014/CP1214/CT0012 under the IF2014 Programme. This work was supported by the H2020-MSCA-RISE-2015 Grant No. StronGrHEP-690904.
References
- Abbott, B. P., Abbott, R., Abbott, T. D., et al. 2016a, ApJ, 818, L22 [Google Scholar]
- Abbott, B. P., Abbott, R., Abbott, T. D., et al. 2016b, Phys. Rev. Lett., 116, 241103 [Google Scholar]
- Bailyn, C. D., Jain, R. K., Coppi, P., & Orosz, J. A. 1998, ApJ, 499, 367 [NASA ADS] [CrossRef] [Google Scholar]
- Barkat, Z., Rakavy, G., & Sack, N. 1967, Phys. Rev. Lett., 18, 379 [NASA ADS] [CrossRef] [Google Scholar]
- Belczynski, K., & Taam, R. E. 2008, ApJ, 685, 400 [NASA ADS] [CrossRef] [Google Scholar]
- Belczynski, K., Kalogera, V., & Bulik, T. 2002, ApJ, 572, 407 [NASA ADS] [CrossRef] [Google Scholar]
- Belczynski, K., Bulik, T., & Rudak, B. 2004, ApJ, 608, L45 [NASA ADS] [CrossRef] [Google Scholar]
- Belczynski, K., Taam, R. E., Kalogera, V., Rasio, F. A., & Bulik, T. 2007, ApJ, 662, 504 [NASA ADS] [CrossRef] [Google Scholar]
- Belczynski, K., Kalogera, V., Rasio, F. A., et al. 2008, ApJS, 174, 223 [NASA ADS] [CrossRef] [Google Scholar]
- Belczynski, K., Bulik, T., Fryer, C. L., et al. 2010a, ApJ, 714, 1217 [NASA ADS] [CrossRef] [Google Scholar]
- Belczynski, K., Dominik, M., Bulik, T., et al. 2010b, ApJ, 715, L138 [NASA ADS] [CrossRef] [Google Scholar]
- Belczynski, K., Wiktorowicz, G., Fryer, C. L., Holz, D. E., & Kalogera, V. 2012, ApJ, 757, 91 [NASA ADS] [CrossRef] [Google Scholar]
- Belczynski, K., Buonanno, A., Cantiello, M., et al. 2014, ApJ, 789, 120 [NASA ADS] [CrossRef] [Google Scholar]
- Belczynski, K., Holz, D. E., Bulik, T., & O’Shaughnessy, R. 2016a, Nature, 534, 512 [NASA ADS] [CrossRef] [Google Scholar]
- Belczynski, K., Repetto, S., Holz, D. E., et al. 2016b, ApJ, 819, 108 [NASA ADS] [CrossRef] [Google Scholar]
- Bond, J. R., Arnett, W. D., & Carr, B. J. 1984, ApJ, 280, 825 [NASA ADS] [CrossRef] [Google Scholar]
- Brown, G. E., Heger, A., Langer, N., et al. 2001, New Astron., 6, 457 [NASA ADS] [CrossRef] [Google Scholar]
- Chatzopoulos, E., & Wheeler, J. C. 2012a, ApJ, 748, 42 [NASA ADS] [CrossRef] [Google Scholar]
- Chatzopoulos, E., & Wheeler, J. C. 2012b, ApJ, 760, 154 [NASA ADS] [CrossRef] [Google Scholar]
- Chatzopoulos, E., Wheeler, J. C., & Couch, S. M. 2013, ApJ, 776, 129 [NASA ADS] [CrossRef] [Google Scholar]
- Chen, K.-J., Woosley, S., Heger, A., Almgren, A., & Whalen, D. J. 2014, ApJ, 792, 28 [CrossRef] [Google Scholar]
- Chen, Y., Bressan, A., Girardi, L., et al. 2015, MNRAS, 452, 1068 [NASA ADS] [CrossRef] [Google Scholar]
- Choi, J., Dotter, A., Conroy, C., et al. 2016, ApJ, 823, 102 [NASA ADS] [CrossRef] [Google Scholar]
- Crowther, P. A., Schnurr, O., Hirschi, R., et al. 2010, MNRAS, 408, 731 [NASA ADS] [CrossRef] [Google Scholar]
- de Mink, S. E., & Belczynski, K. 2015, ApJ, 814, 58 [NASA ADS] [CrossRef] [Google Scholar]
- de Mink, S. E., & Mandel, I. 2016, MNRAS, 460, 3545 [NASA ADS] [CrossRef] [Google Scholar]
- Dessart, L., Burrows, A., Livne, E., & Ott, C. D. 2007, ApJ, 669, 585 [NASA ADS] [CrossRef] [Google Scholar]
- Dominik, M., Belczynski, K., Fryer, C., et al. 2012, ApJ, 759, 52 [NASA ADS] [CrossRef] [Google Scholar]
- Dominik, M., Belczynski, K., Fryer, C., et al. 2013, ApJ, 779, 72 [NASA ADS] [CrossRef] [Google Scholar]
- Dominik, M., Berti, E., O’Shaughnessy, R., et al. 2015, ApJ, 806, 263 [NASA ADS] [CrossRef] [Google Scholar]
- Dvorkin, I., Silk, J., Vangioni, E., Petitjean, P., & Olive, K. A. 2015, MNRAS, 452, L36 [NASA ADS] [CrossRef] [Google Scholar]
- Dvorkin, I., Vangioni, E., Silk, J., Uzan, J.-P., & Olive, K. A. 2016, MNRAS, 461, 3877 [NASA ADS] [CrossRef] [Google Scholar]
- Eldridge, J. J., & Stanway, E. R. 2016, MNRAS, 462, 3302 [NASA ADS] [CrossRef] [Google Scholar]
- Eroshenko, Y. N. 2016, ArXiv e-prints [arXiv:1604.04932] [Google Scholar]
- Ertl, T., Janka, H.-T., Woosley, S. E., Sukhbold, T., & Ugliano, M. 2016, ApJ, 818, 124 [NASA ADS] [CrossRef] [Google Scholar]
- Flanagan, É. É., & Hughes, S. A. 1998, Phys. Rev. D, 57, 4535 [NASA ADS] [CrossRef] [Google Scholar]
- Fryer, C. L. 2006, New Astron. Rev., 50, 492 [NASA ADS] [CrossRef] [Google Scholar]
- Fryer, C. 2014, PoS(FRAPWS2014)004 [Google Scholar]
- Fryer, C. L., Woosley, S. E., & Heger, A. 2001, ApJ, 550, 372 [NASA ADS] [CrossRef] [Google Scholar]
- Fryer, C. L., Belczynski, K., Wiktorowicz, G., et al. 2012, ApJ, 749, 91 [NASA ADS] [CrossRef] [Google Scholar]
- Georgy, C., Ekström, S., Eggenberger, P., et al. 2013, A&A, 558, A103 [NASA ADS] [CrossRef] [EDP Sciences] [Google Scholar]
- Hartwig, T., Volonteri, M., Bromm, V., et al. 2016, MNRAS, 460, L74 [NASA ADS] [CrossRef] [Google Scholar]
- Heger, A., & Woosley, S. E. 2002, ApJ, 567, 532 [NASA ADS] [CrossRef] [Google Scholar]
- Heger, A., Fryer, C. L., Woosley, S. E., Langer, N., & Hartmann, D. H. 2003, ApJ, 591, 288 [NASA ADS] [CrossRef] [Google Scholar]
- Hobbs, G., Lorimer, D. R., Lyne, A. G., & Kramer, M. 2005, MNRAS, 360, 974 [NASA ADS] [CrossRef] [Google Scholar]
- Horiuchi, S., Beacom, J. F., Kochanek, C. S., et al. 2011, ApJ, 738, 154 [NASA ADS] [CrossRef] [Google Scholar]
- Hujeirat, A. A. 2016, ArXiv e-prints [arXiv:1604.07882] [Google Scholar]
- Hurley, J. R., Pols, O. R., & Tout, C. A. 2000, MNRAS, 315, 543 [NASA ADS] [CrossRef] [Google Scholar]
- Husa, S., Khan, S., Hannam, M., et al. 2016, Phys. Rev. D, 93, 044006 [NASA ADS] [CrossRef] [Google Scholar]
- Inayoshi, K., Kashiyama, K., Visbal, E., & Haiman, Z. 2016, MNRAS, 461, 2722 [NASA ADS] [CrossRef] [Google Scholar]
- Khan, S., Husa, S., Hannam, M., et al. 2016, Phys. Rev. D, 93, 044007 [NASA ADS] [CrossRef] [Google Scholar]
- Kinugawa, T., Inayoshi, K., Hotokezaka, K., Nakauchi, D., & Nakamura, T. 2014, MNRAS, 442, 2963 [NASA ADS] [CrossRef] [Google Scholar]
- Kistler, M. D., Yüksel, H., Beacom, J. F., Hopkins, A. M., & Wyithe, J. S. B. 2009, ApJ, 705, L104 [NASA ADS] [CrossRef] [Google Scholar]
- Kobulnicky, H. A., Kiminki, D. C., Lundquist, M. J., et al. 2014, ApJS, 213, 34 [NASA ADS] [CrossRef] [Google Scholar]
- Kreidberg, L., Bailyn, C. D., Farr, W. M., & Kalogera, V. 2012, ApJ, 757, 36 [NASA ADS] [CrossRef] [Google Scholar]
- Lattimer, J. M., & Yahil, A. 1989, ApJ, 340, 426 [NASA ADS] [CrossRef] [Google Scholar]
- Limongi, M., & Chieffi, A. 2006, ApJ, 647, 483 [NASA ADS] [CrossRef] [Google Scholar]
- Lipunov, V. M., Postnov, K. A., & Prokhorov, M. E. 1997, Astron. Lett., 23, 492 [NASA ADS] [Google Scholar]
- Loeb, A. 2016, ApJ, 819, L21 [NASA ADS] [CrossRef] [Google Scholar]
- MacLeod, M., & Ramirez-Ruiz, E. 2015, ApJ, 803, 41 [NASA ADS] [CrossRef] [Google Scholar]
- Madau, P., & Dickinson, M. 2014, ARA&A, 52, 415 [NASA ADS] [CrossRef] [Google Scholar]
- Mandel, I., & de Mink, S. E. 2016, MNRAS, 458, 2634 [NASA ADS] [CrossRef] [Google Scholar]
- Mapelli, M. 2016, MNRAS, 459, 3432 [NASA ADS] [CrossRef] [Google Scholar]
- Mapelli, M., Colpi, M., & Zampieri, L. 2009, MNRAS, 395, L71 [NASA ADS] [CrossRef] [Google Scholar]
- Marchant, P., Langer, N., Podsiadlowski, P., Tauris, T. M., & Moriya, T. J. 2016, A&A, 588, A50 [NASA ADS] [CrossRef] [EDP Sciences] [Google Scholar]
- Mennekens, N., & Vanbeveren, D. 2014, A&A, 564, A134 [NASA ADS] [CrossRef] [EDP Sciences] [Google Scholar]
- Mitchell-Wynne, K., Cooray, A., Gong, Y., et al. 2015, Nat. Comm., 6, 7945 [NASA ADS] [CrossRef] [Google Scholar]
- Nelemans, G., Yungelson, L. R., & Portegies Zwart, S. F. 2001, A&A, 375, 890 [NASA ADS] [CrossRef] [EDP Sciences] [Google Scholar]
- O’Connor, E., & Ott, C. D. 2011, ApJ, 730, 70 [NASA ADS] [CrossRef] [Google Scholar]
- Özel, F., Psaltis, D., Narayan, R., & McClintock, J. E. 2010, ApJ, 725, 1918 [NASA ADS] [CrossRef] [Google Scholar]
- Pavlovskii, K., Ivanova, N., Belczynski, K., & Van, K. X. 2016, MNRAS, submitted [arXiv:1606.04921] [Google Scholar]
- Perna, R., Lazzati, D., & Giacomazzo, B. 2016, ApJ, 821, L18 [NASA ADS] [CrossRef] [Google Scholar]
- Podsiadlowski, P., Joss, P. C., & Hsu, J. J. L. 1992, ApJ, 391, 246 [NASA ADS] [CrossRef] [Google Scholar]
- Poelarends, A. J. T., Herwig, F., Langer, N., & Heger, A. 2008, ApJ, 675, 614 [NASA ADS] [CrossRef] [Google Scholar]
- Postnov, K. A., & Yungelson, L. R. 2006, Liv. Rev. Relativ., 9, 6 [NASA ADS] [CrossRef] [Google Scholar]
- Ricker, P. M., & Taam, R. E. 2008, ApJ, 672, L41 [NASA ADS] [CrossRef] [Google Scholar]
- Rodriguez, C. L., Morscher, M., Pattabiraman, B., et al. 2015, Phys. Rev. Lett., 115, 051101 [NASA ADS] [CrossRef] [Google Scholar]
- Rodriguez, C. L., Chatterjee, S., & Rasio, F. A. 2016, Phys. Rev. D, 93, 084029 [NASA ADS] [CrossRef] [Google Scholar]
- Sana, H., de Mink, S. E., de Koter, A., et al. 2012, Science, 337, 444 [Google Scholar]
- Sasaki, M., Suyama, T., Tanaka, T., & Yokoyama, S. 2016, Phys. Rev. Lett. 117, 061101 [Google Scholar]
- Schutz, B. F. 1989, in NASA Conference Publication, ed. R. W. Hellings, 3046, 7 [Google Scholar]
- Spera, M., Mapelli, M., & Bressan, A. 2015, MNRAS, 451, 4086 [NASA ADS] [CrossRef] [Google Scholar]
- Spera, M., Giacobbo, N., & Mapelli, M. 2016, ArXiv e-prints [arXiv:1606.03349] [Google Scholar]
- Strolger, L.-G., Riess, A. G., Dahlen, T., et al. 2004, ApJ, 613, 200 [NASA ADS] [CrossRef] [Google Scholar]
- The LIGO Scientific Collaboration, the Virgo Collaboration 2013, ArXiv e-prints [Google Scholar]
- The LIGO Scientific Collaboration, the Virgo Collaboration 2016, ArXiv e-prints [arXiv:1606.04856] [Google Scholar]
- Thorne, K. S. 1987, in Gravitational radiation., eds. S. W. Hawking, & W. Israel, 330 [Google Scholar]
- Timmes, F. X., Woosley, S. E., & Weaver, T. A. 1996, ApJ, 457, 834 [NASA ADS] [CrossRef] [Google Scholar]
- Tutukov, A. V., & Yungelson, L. R. 1993, MNRAS, 260, 675 [NASA ADS] [CrossRef] [Google Scholar]
- Vangioni, E., Olive, K. A., Prestegard, T., et al. 2015, MNRAS, 447, 2575 [NASA ADS] [CrossRef] [Google Scholar]
- Villante, F. L., Serenelli, A. M., Delahaye, F., & Pinsonneault, M. H. 2014, ApJ, 787, 13 [NASA ADS] [CrossRef] [Google Scholar]
- Vink, J. S. 2011, Ap&SS, 336, 163 [NASA ADS] [CrossRef] [Google Scholar]
- Voss, R., & Tauris, T. M. 2003, MNRAS, 342, 1169 [NASA ADS] [CrossRef] [Google Scholar]
- Woosley, S. E. 2016, ApJ, 824, L10 [NASA ADS] [CrossRef] [Google Scholar]
- Woosley, S. E., & Heger, A. 2015, in Very Massive Stars in the Local Universe, ed. J. S. Vink, Astrophys. Space Sci. Libr., 412, 199 [Google Scholar]
- Woosley, S. E., Heger, A., & Weaver, T. A. 2002, Rev. Mod. Phys., 74, 1015 [NASA ADS] [CrossRef] [Google Scholar]
- Woosley, S. E., Blinnikov, S., & Heger, A. 2007, Nature, 450, 390 [NASA ADS] [CrossRef] [PubMed] [Google Scholar]
- Xu, X.-J., & Li, X.-D. 2010, ApJ, 722, 1985 [NASA ADS] [CrossRef] [Google Scholar]
- Young, P. A., Ellinger, C. I., Arnett, D., Fryer, C. L., & Rockefeller, G. 2009, ApJ, 699, 938 [NASA ADS] [CrossRef] [Google Scholar]
- Yusof, N., Hirschi, R., Meynet, G., et al. 2013, MNRAS, 433, 1114 [NASA ADS] [CrossRef] [Google Scholar]
- Zampieri, L., & Roberts, T. P. 2009, MNRAS, 400, 677 [NASA ADS] [CrossRef] [Google Scholar]
All Tables
All Figures
|
Fig. 1 Star-formation rate (SFR) as a function of redshift and cosmic time. The blue dashed line shows the SFR used in our previous studies, while the red line indicates the most recent update (used in this study). We note that for high redshifts (z> 2) the updated SFR generates less stars, and thus reduces formation rates of BH-BH progenitors. We marked the two highest redshift GRBs. Since GRBs form from stars or stellar remnant mergers, their positions mark the lower limit on the beginning of star formation. We also mark the detection horizon for the full advanced LIGO design sensitivity. We assume that Population II and I stars (considered in this study) form at redshifts z< 15. |
| In the text | |
|
Fig. 2 Initial-final mass relation for single stars. Models with (M10) and without (M1) pair-instability pulsation supernovae and pair-instability supernovae are shown. Bottom panel: at high metallicity (Z = 10% Z⊙ and higher) the models are indistinguishable. For the border-line metallicity of Z = 10% Z⊙, stars with very high initial mass (Mzams> 100 M⊙) will form slightly lighter BHs (by ~ 2 M⊙) if pair-instability pulsation supernovae are included. Top panel: at low metallicity (e.g., Z = 0.5% Z⊙) pair-instability pulsation supernovae and pair-instability supernovae do not allow for high mass BH formation; maximum BH mass is MBH = 45 M⊙. For the very low metallicity of Z = 0.5% Z⊙, very massive stars (Mzams ≈ 100−140 M⊙) lose significant mass in pair-instability pulsation supernovae reducing the BH mass to MBH ≈ 40 M⊙, while the most massive stars (Mzams> 140 M⊙) explode in pair-instability supernovae leaving no remnant. |
| In the text | |
|
Fig. 3 Total intrinsic (not weighted by merger rate or by detection probability) merger-mass distribution for two progenitor stellar populations of different metallicity. Models with (M10) and without (M1) pair-instability pulsation supernovae and pair-instability supernovae are shown. Bottom panel: at high metallicity, (Z = 10% Z⊙ and higher) models are indistinguishable. Top panel: at low metallicity (e.g., Z = 0.5% Z⊙), pair-instability pulsation supernovae and pair-instability supernovae do not allow for high mass-merger formation (Mtot ≲ 80 M⊙). We note that the model that does not take into account pair-instability pulsation supernovae and pair-instability supernovae allows for the formation of high mass mergers (Mtot> 80 M⊙). |
| In the text | |
|
Fig. 4 Source frame merger-rate density for BH-BH binaries. We note that there is virtually no change of the rate at any redshift for models with (M10) and without (M1) pair-instability pulsation supernovae and pair-instability supernovae. For reference, we plotted the horizon distance for our most massive BH-BH merger in model M10 (Mtot ≈ 80 M⊙; see Fig. 3). We also show our pessimistic model with high natal kicks (M3). |
| In the text | |
|
Fig. 5 Left panel: observer frame (redshifted) total merger mass distribution for our models: with (M10; magenta broken line) and without (M1; red solid line) pair-instability pulsation supernovae and pair-instability supernovae included. The fiducial O2 LIGO upper limits are marked; the most likely detections are expected when our models are above these upper limits. We note that both models are hardly distinguishable by total merger mass with O2 observations, despite the fact that more massive BH-BH mergers are produced in model M1. The two detections and the next loudest gravitational-wave event from LIGO O1 observations (The LIGO Scientific Collaboration et al. 2016) are marked: GW150914 (36 + 29 M⊙ BH-BH merger at z ≈ 0.1), GW151226 (14 + 8 M⊙ BH-BH merger at z ≈ 0.1), and LVT151012 (23 + 13 M⊙ BH-BH merger at z ≈ 0.2). Right panel: source frame BH-BH merger-rate density for the local Universe. The local source frame BH-BH merger-rate density estimated by LIGO from the O1 run: 9−240 Gpc-3 yr-1 (range marked with blue arrows) may be compared to our local (z< 0.1) source frame rate of RBHBH ≈ 220 Gpc-3 yr-1 (M1 and M10 models). Both model rate densities are almost the same and are within the LIGO estimate. We additionally show the results for our pessimistic model (M3) with high natal kicks: RBHBH ≈ 7 Gpc-3 yr-1 (just below the LIGO allowed range). |
| In the text | |
Current usage metrics show cumulative count of Article Views (full-text article views including HTML views, PDF and ePub downloads, according to the available data) and Abstracts Views on Vision4Press platform.
Data correspond to usage on the plateform after 2015. The current usage metrics is available 48-96 hours after online publication and is updated daily on week days.
Initial download of the metrics may take a while.