Fig. 6
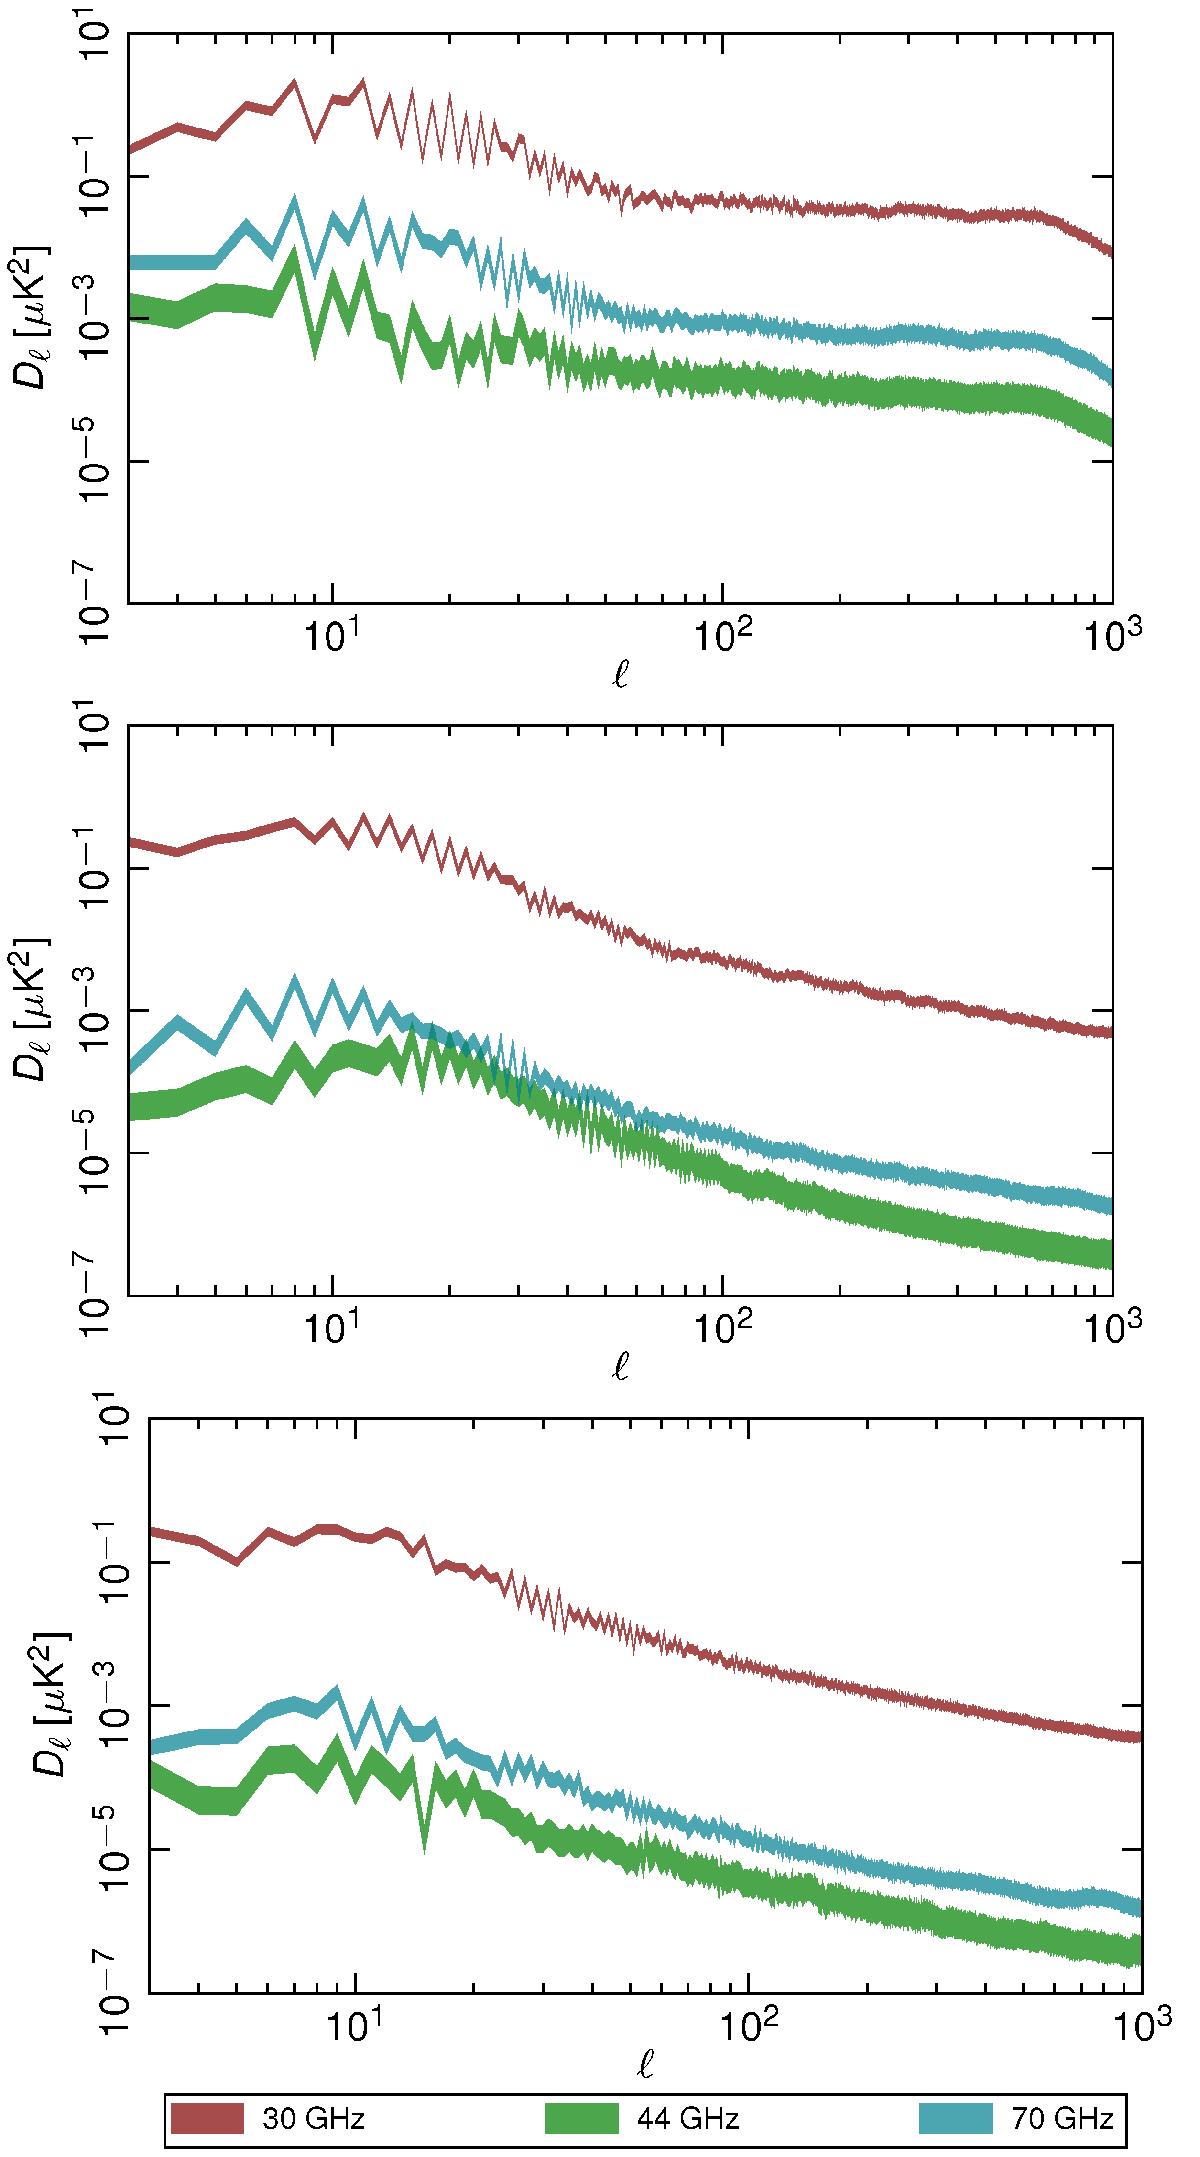
Uncertainty in the power spectra of the effect from far sidelobes introduced by the first-order approximation in GRASP simulations. Top: TT spectrum. Middle: EE spectrum. Bottom: BB spectrum. For each frequency the coloured area is the region between the native power spectrum and the one rescaled to account for the missing power.
Current usage metrics show cumulative count of Article Views (full-text article views including HTML views, PDF and ePub downloads, according to the available data) and Abstracts Views on Vision4Press platform.
Data correspond to usage on the plateform after 2015. The current usage metrics is available 48-96 hours after online publication and is updated daily on week days.
Initial download of the metrics may take a while.