Free Access
Fig. 22
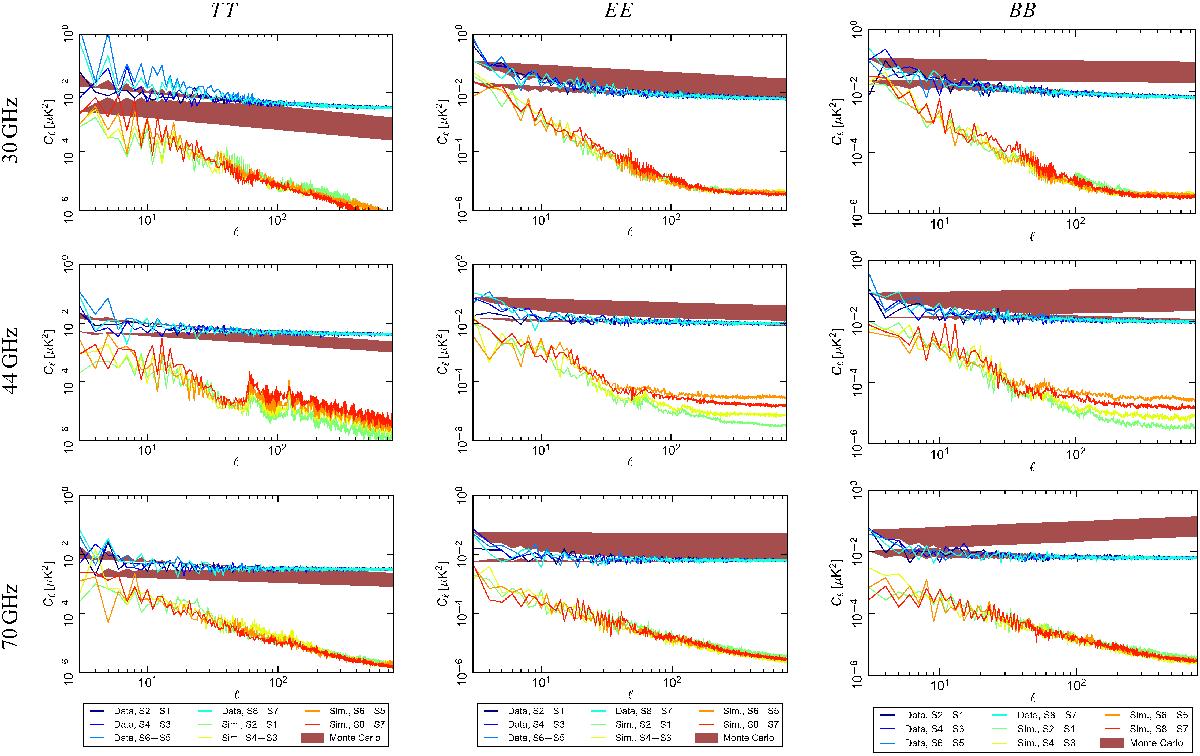
Angular power spectra of consecutive survey difference maps. Coloured lines represent the four nulls obtained from data and simulations of the effects listed in Table 2. The coloured area represents the envelope from Monte Carlo simulations as described in the text.
Current usage metrics show cumulative count of Article Views (full-text article views including HTML views, PDF and ePub downloads, according to the available data) and Abstracts Views on Vision4Press platform.
Data correspond to usage on the plateform after 2015. The current usage metrics is available 48-96 hours after online publication and is updated daily on week days.
Initial download of the metrics may take a while.