Fig. 16
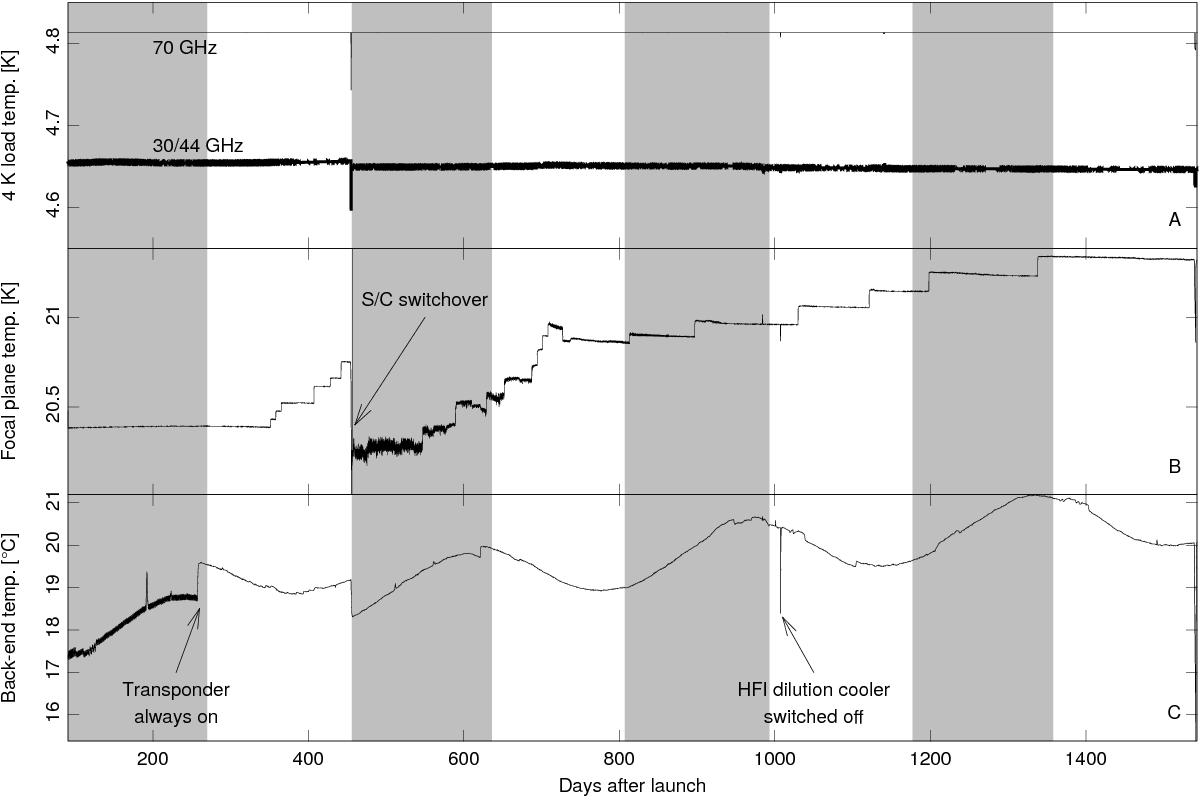
Top: temperature measured by two sensors mounted on the HFI 4-K shield at the level of 30 and 44GHz (bottom curve) and 70GHz (top curve) reference loads. The rms variation of this temperature over the full mission is σ30,44 = 1.55mK and σ70 = 80μK. Middle: temperature of the 20-K focal plane measured by a temperature sensor placed on the flange of the LFI28 30GHz feedhorn. The consecutive temperature steps after day 500 reflect changes to the set point of the temperature control system. We applied these changes to control the level of temperature fluctuations. Bottom: temperature of the 300-K back-end unit.
Current usage metrics show cumulative count of Article Views (full-text article views including HTML views, PDF and ePub downloads, according to the available data) and Abstracts Views on Vision4Press platform.
Data correspond to usage on the plateform after 2015. The current usage metrics is available 48-96 hours after online publication and is updated daily on week days.
Initial download of the metrics may take a while.