Fig. 12
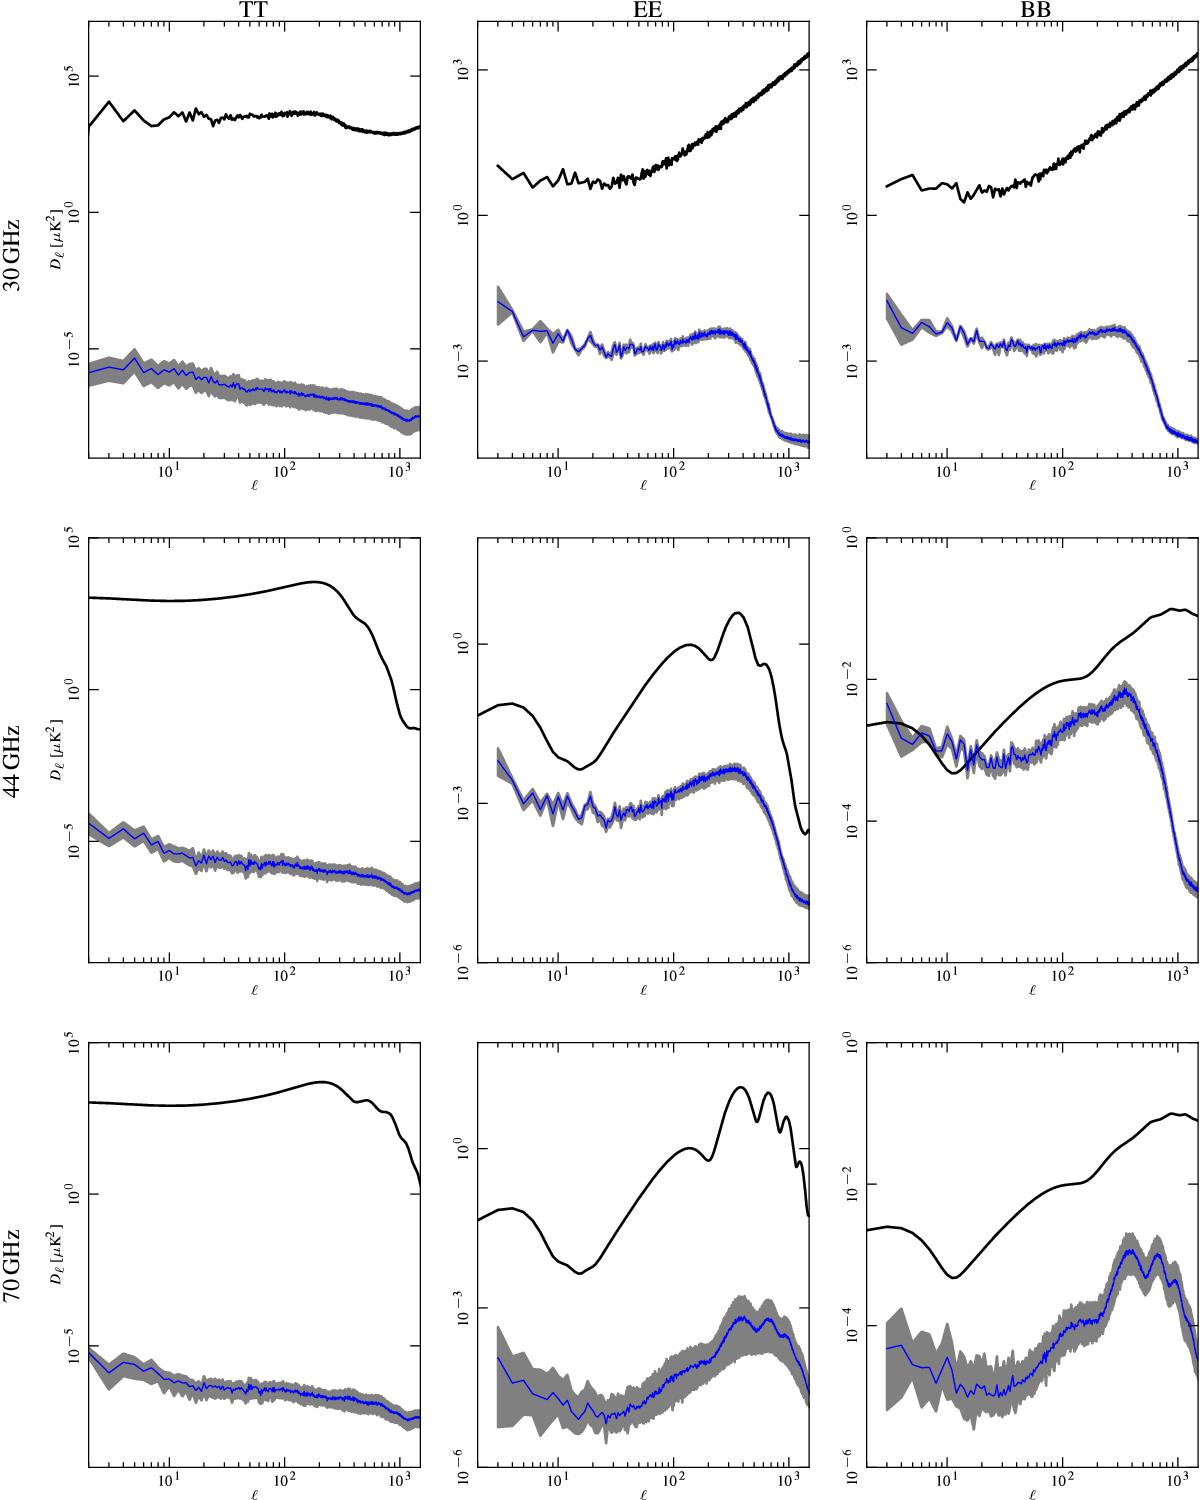
Angular power spectra of the residual effect of polarization angle uncertainty compared to the foreground spectra at 30GHz and to Planck beam-filtered temperature and polarization spectra at 44 and 70GHz. The blue curve represents the average spectrum, while the grey band is the envelope of all the power spectra calculated from the various realizations of the effect. The theoretical B-mode CMB spectrum assumes a tensor-to-scalar ratio r = 0.1, a tensor spectral index nT = 0 and has not been beam-filtered. Rows are for 30, 44, and 70GHz spectra, while columns are for TT, EE, and BB power spectra.
Current usage metrics show cumulative count of Article Views (full-text article views including HTML views, PDF and ePub downloads, according to the available data) and Abstracts Views on Vision4Press platform.
Data correspond to usage on the plateform after 2015. The current usage metrics is available 48-96 hours after online publication and is updated daily on week days.
Initial download of the metrics may take a while.