Fig. 8
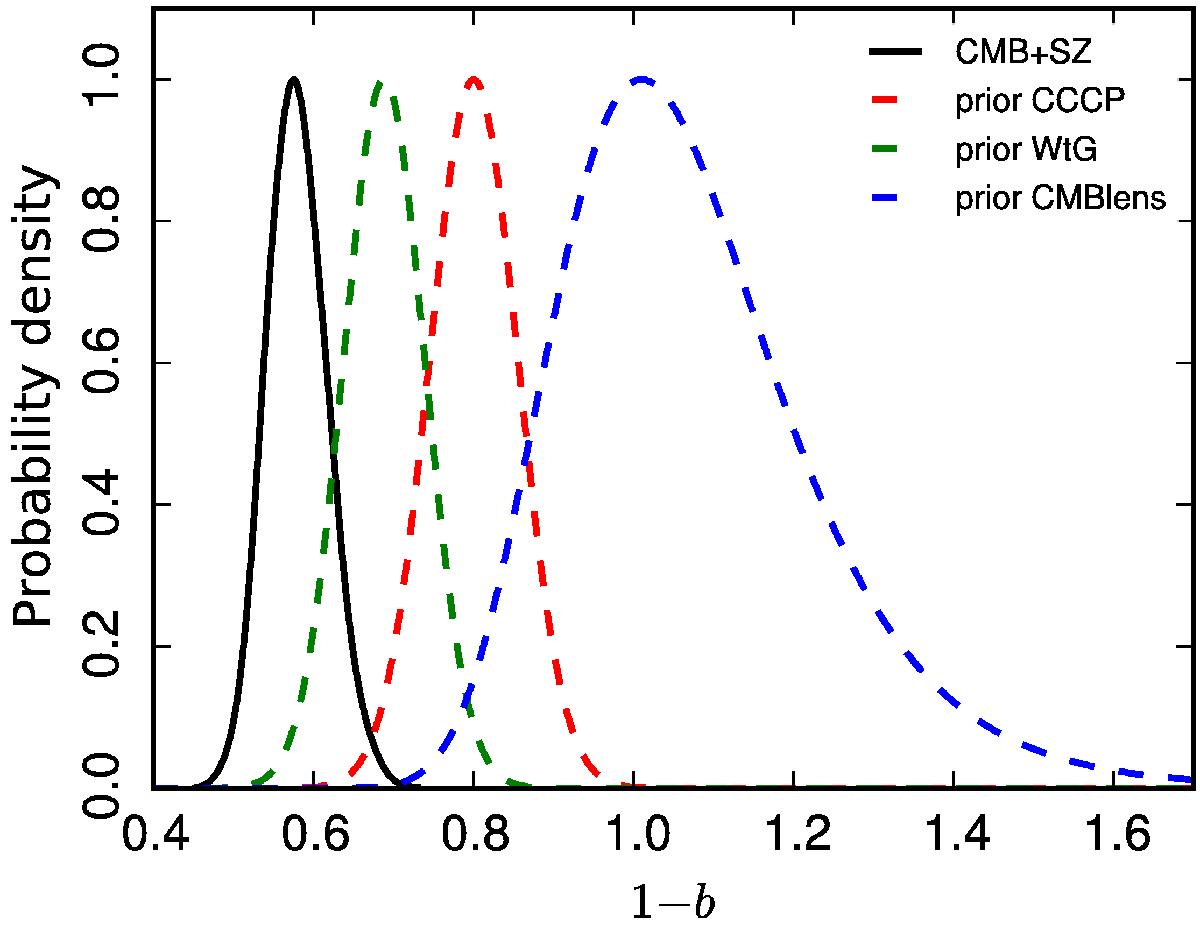
Comparison of cluster and primary CMB constraints in the base ΛCDM model, expressed in terms of the mass bias, 1−b. The solid black curve shows the distribution of values required to reconcile the counts and primary CMB in ΛCDM; it is found as the posterior on 1−b from a joint analysis of the Planck cluster counts and primary CMB when leaving the mass bias free. The coloured dashed curves show the three prior distributions on the mass bias listed in Table 2.
Current usage metrics show cumulative count of Article Views (full-text article views including HTML views, PDF and ePub downloads, according to the available data) and Abstracts Views on Vision4Press platform.
Data correspond to usage on the plateform after 2015. The current usage metrics is available 48-96 hours after online publication and is updated daily on week days.
Initial download of the metrics may take a while.