Fig. 4
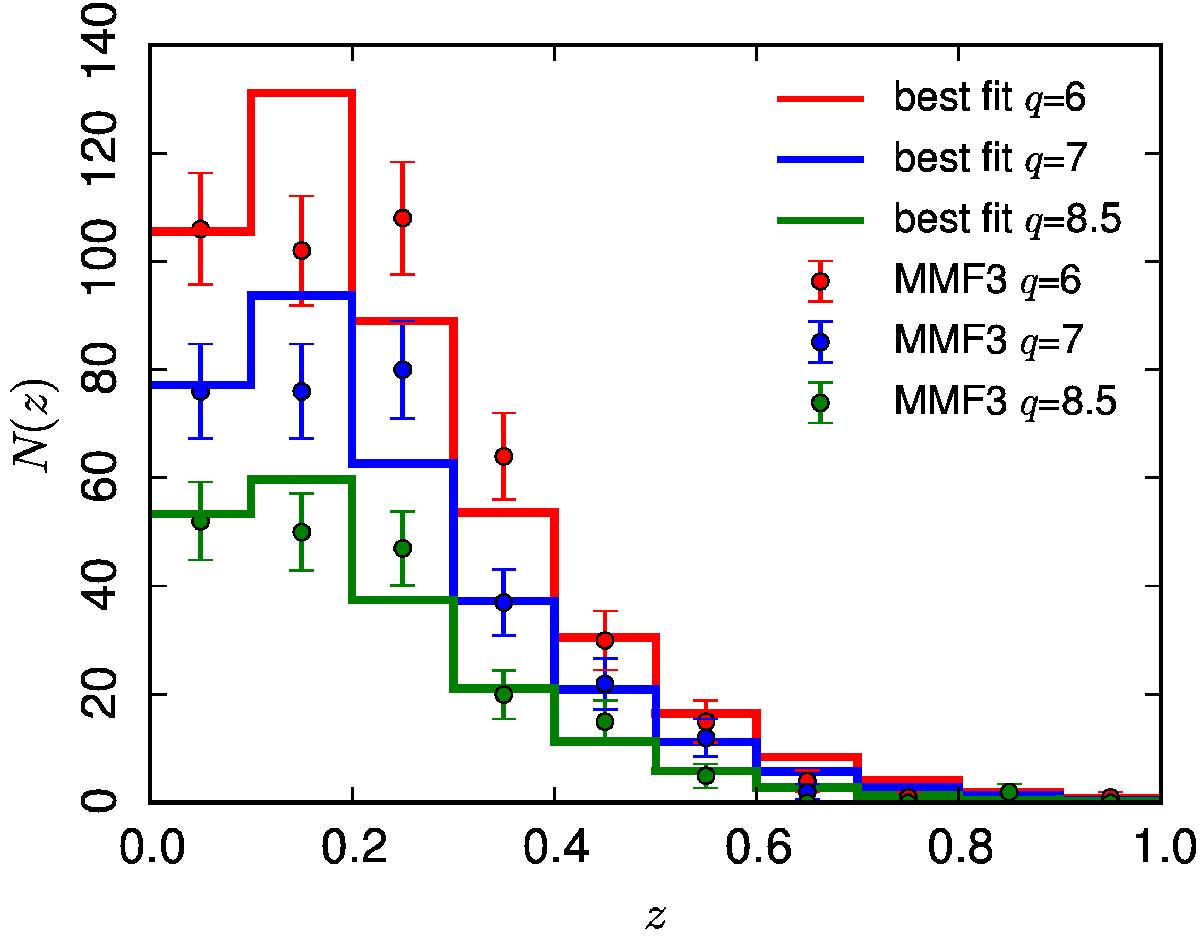
Comparison of observed counts (points with error bars) with predictions of the best-fit models (solid lines) from the one-dimensional likelihood for three different thresholds applied to the 2015 MMF3 cosmology sample. The mismatch between observed and predicted counts in the second and third lowest redshift bins, already noticed in the 2013 analysis, increases at lower thresholds, q. The best-fit models are defined by the constraints shown in Fig. 3. For this figure and Fig. 3, we use our one-dimensional likelihood over the redshift distribution, dN/ dz (Eq. (4)), with the mass biased fixed at (1−b) = 0.8.
Current usage metrics show cumulative count of Article Views (full-text article views including HTML views, PDF and ePub downloads, according to the available data) and Abstracts Views on Vision4Press platform.
Data correspond to usage on the plateform after 2015. The current usage metrics is available 48-96 hours after online publication and is updated daily on week days.
Initial download of the metrics may take a while.