Fig. 3
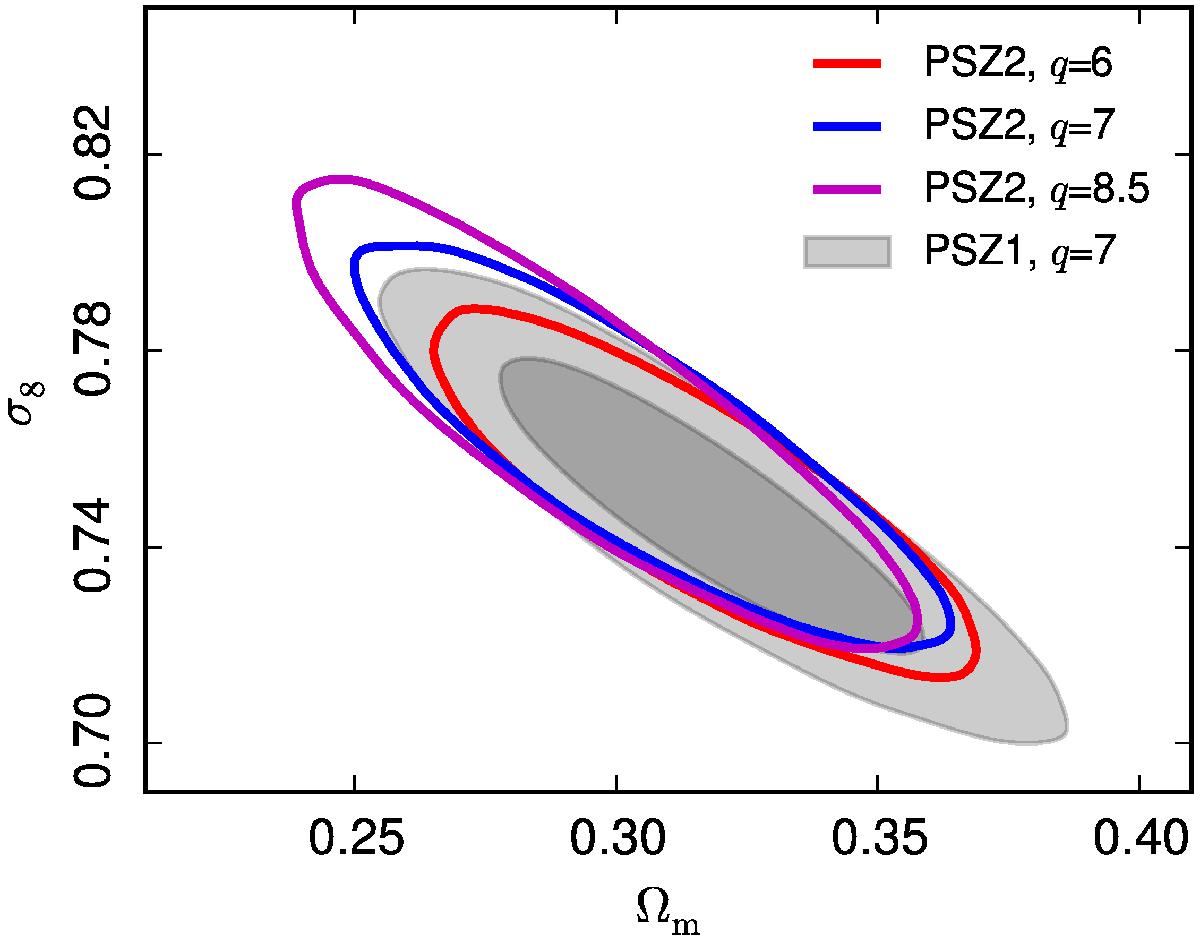
Contours at 95% for different signal-to-noise thresholds, q = 8.5, 7, and 6, applied to the 2015 MMF3 cosmology sample for the SZ+BAO+BBN data set. The contours are compatible with the 2013 constraints (Planck Collaboration XX 2014), shown as the filled, light grey ellipses at 68 and 95% (for the BAO and BBN priors of Sect 5.2; see text). The 2015 catalogue thresholded at q> 8.5 has a similar number of clusters (190) as the 2013 catalogue (189). This comparison is made using the analytical error-function model for completeness and adopts the reference observable-mass scaling relation of the 2013 analysis (1−b = 0.8, see text). The redshift distributions of the best-fit models are shown in Fig. 4. For this figure and Fig. 4, we use the one-dimensional likelihood over the redshift distribution, dN/ dz (Eq. (4)).
Current usage metrics show cumulative count of Article Views (full-text article views including HTML views, PDF and ePub downloads, according to the available data) and Abstracts Views on Vision4Press platform.
Data correspond to usage on the plateform after 2015. The current usage metrics is available 48-96 hours after online publication and is updated daily on week days.
Initial download of the metrics may take a while.