Free Access
Fig. A.4
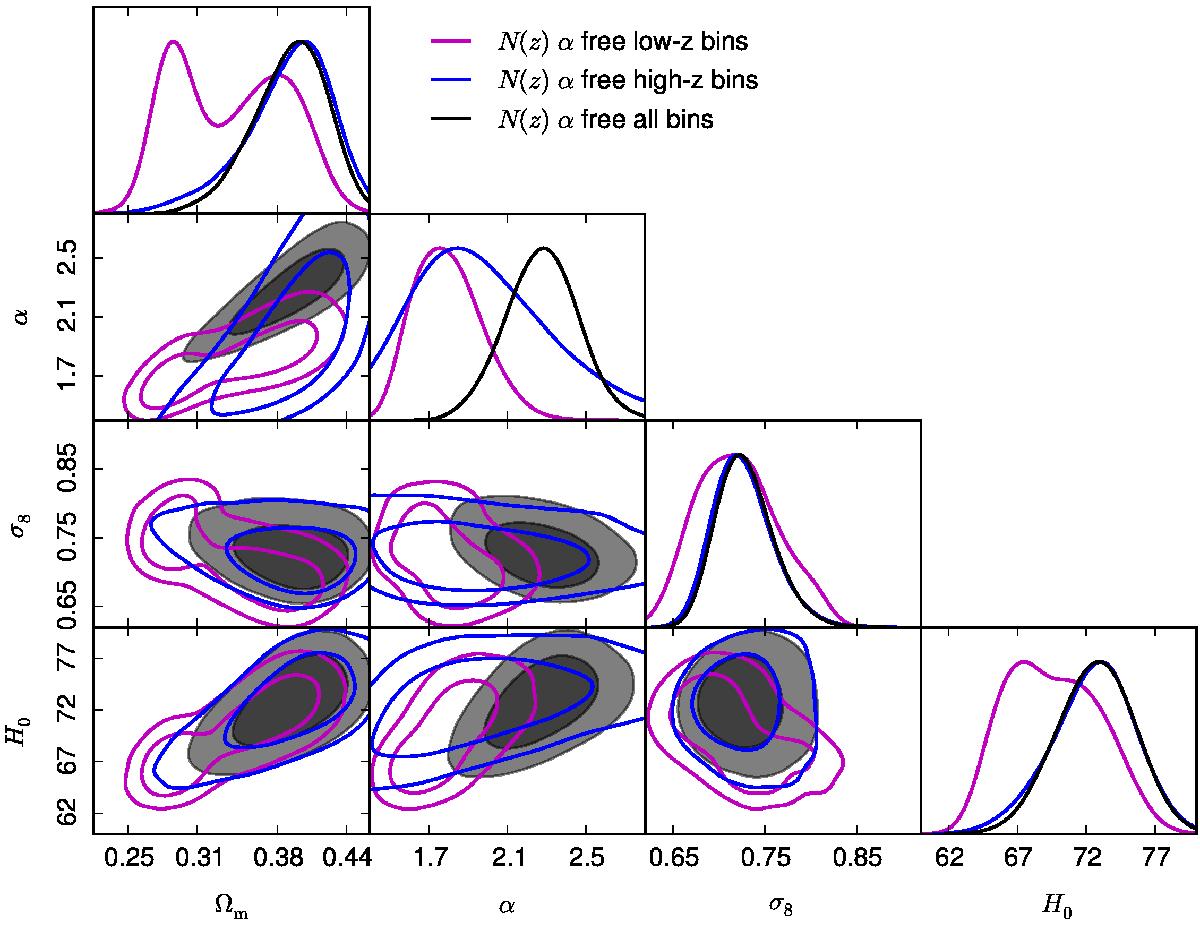
Comparison of constraints from the full redshift distribution (in black) to those from the redshift split: two bins at z< 0.2 (in purple) and eight bins at z> 0.2 (in blue). The constraints are obtained with the one-dimensional likelihood when leaving α free, and the black curves and contours reproduce those from Fig. 5.
Current usage metrics show cumulative count of Article Views (full-text article views including HTML views, PDF and ePub downloads, according to the available data) and Abstracts Views on Vision4Press platform.
Data correspond to usage on the plateform after 2015. The current usage metrics is available 48-96 hours after online publication and is updated daily on week days.
Initial download of the metrics may take a while.