Free Access
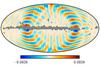
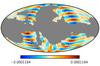
Fig. 5
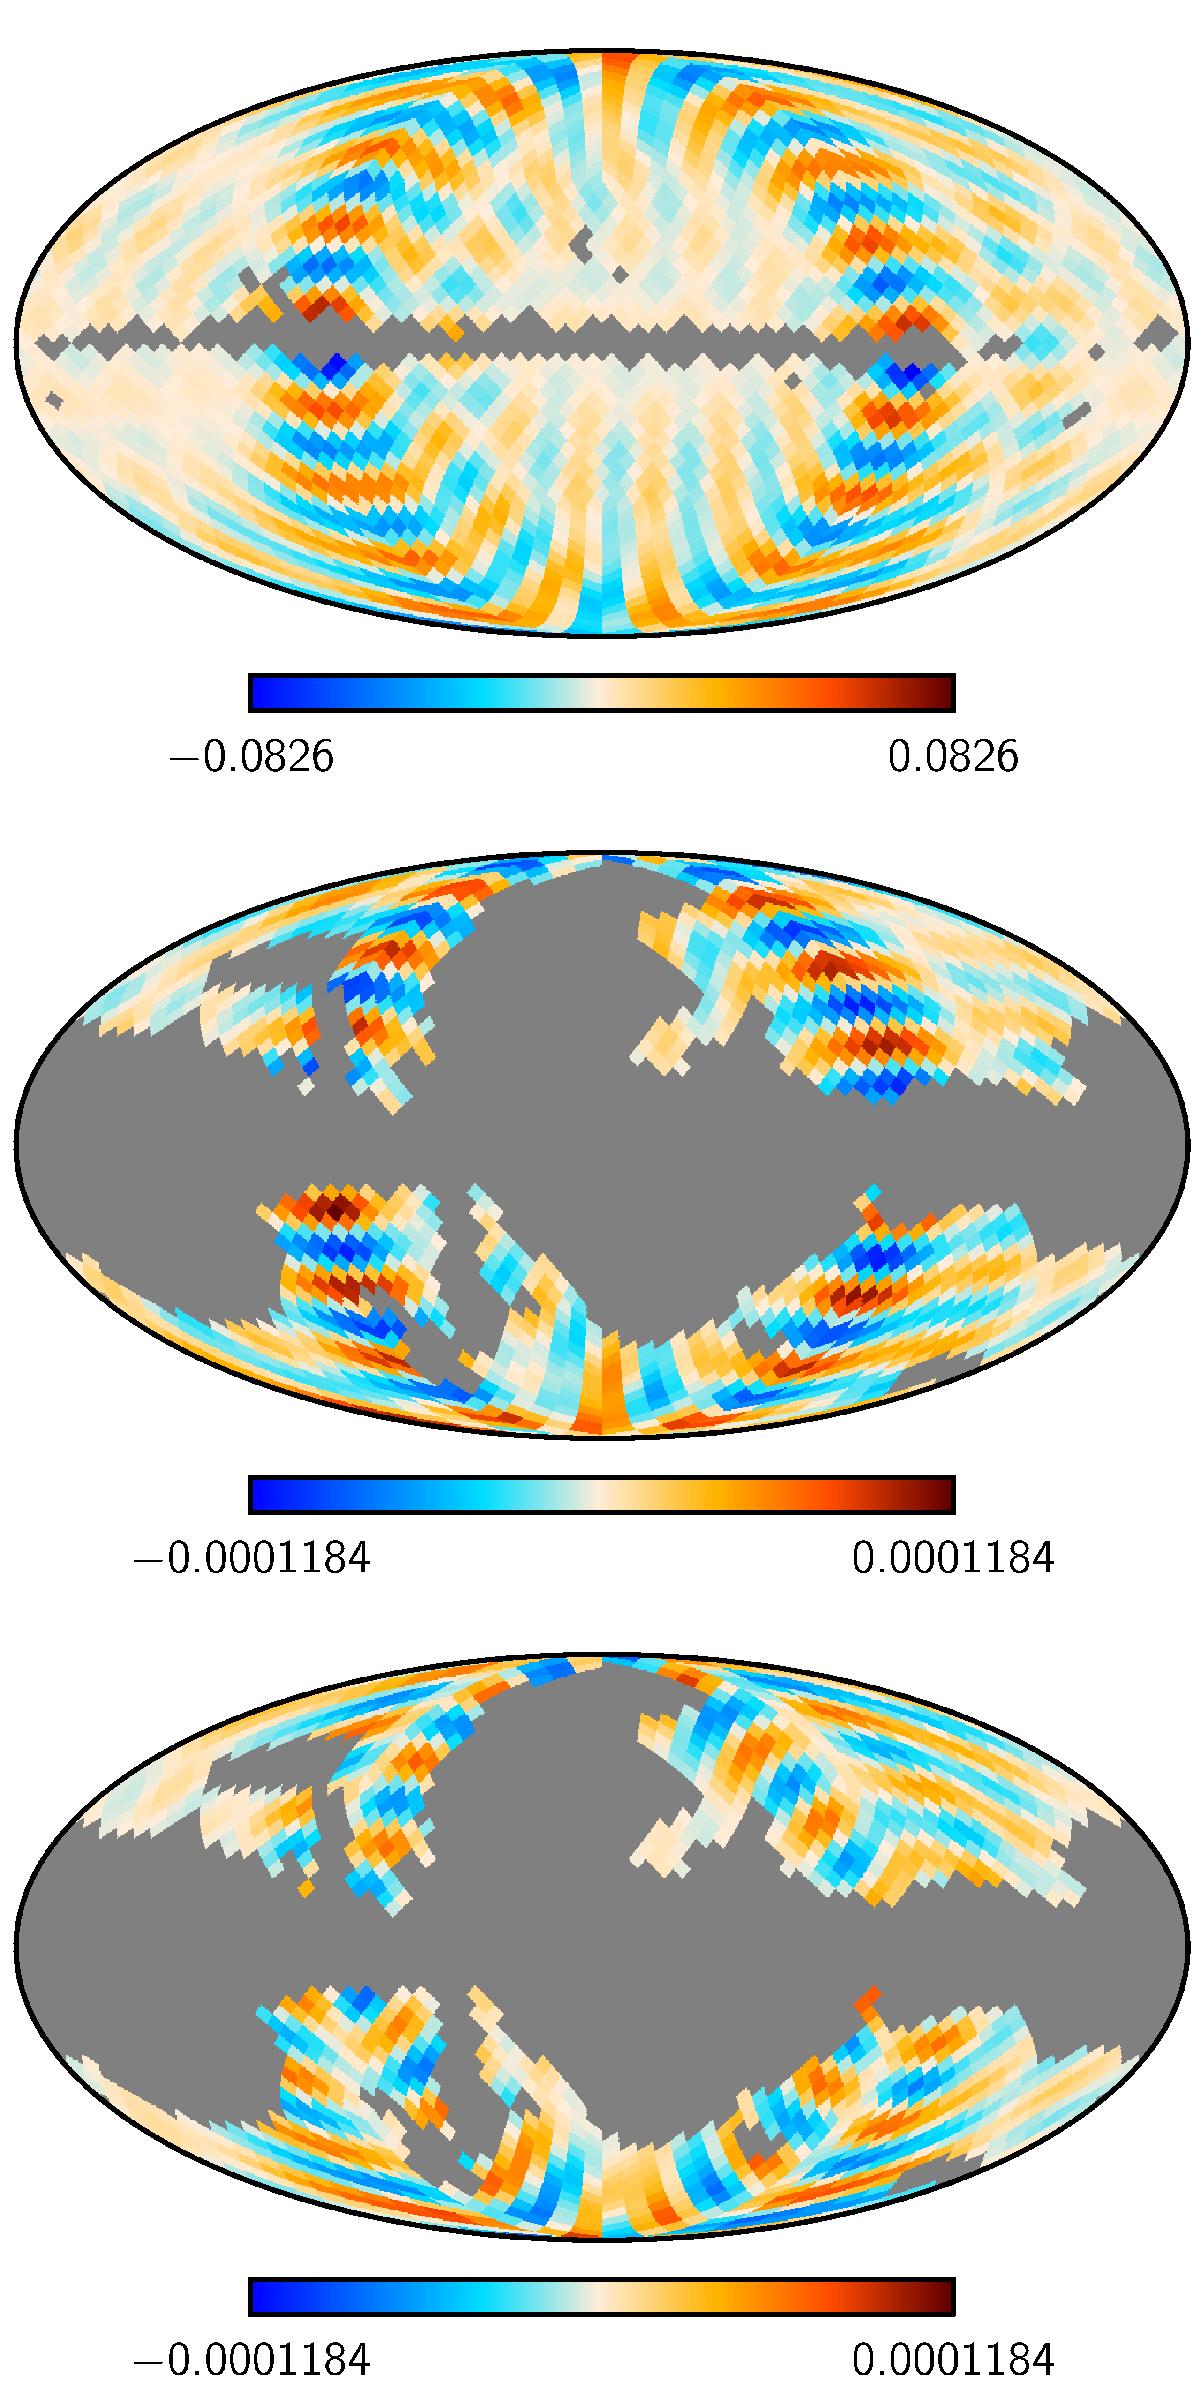
Mode structure plotted as maps for the eigenvector corresponding to the 301st-highest-signal eigenvalue of the fiducial simply-connected model. The top map corresponds to temperature, middle to Q polarization, and bottom to U polarization. Masked pixels are plotted in grey.
This figure is made of several images, please see below:
Current usage metrics show cumulative count of Article Views (full-text article views including HTML views, PDF and ePub downloads, according to the available data) and Abstracts Views on Vision4Press platform.
Data correspond to usage on the plateform after 2015. The current usage metrics is available 48-96 hours after online publication and is updated daily on week days.
Initial download of the metrics may take a while.