Fig. 11
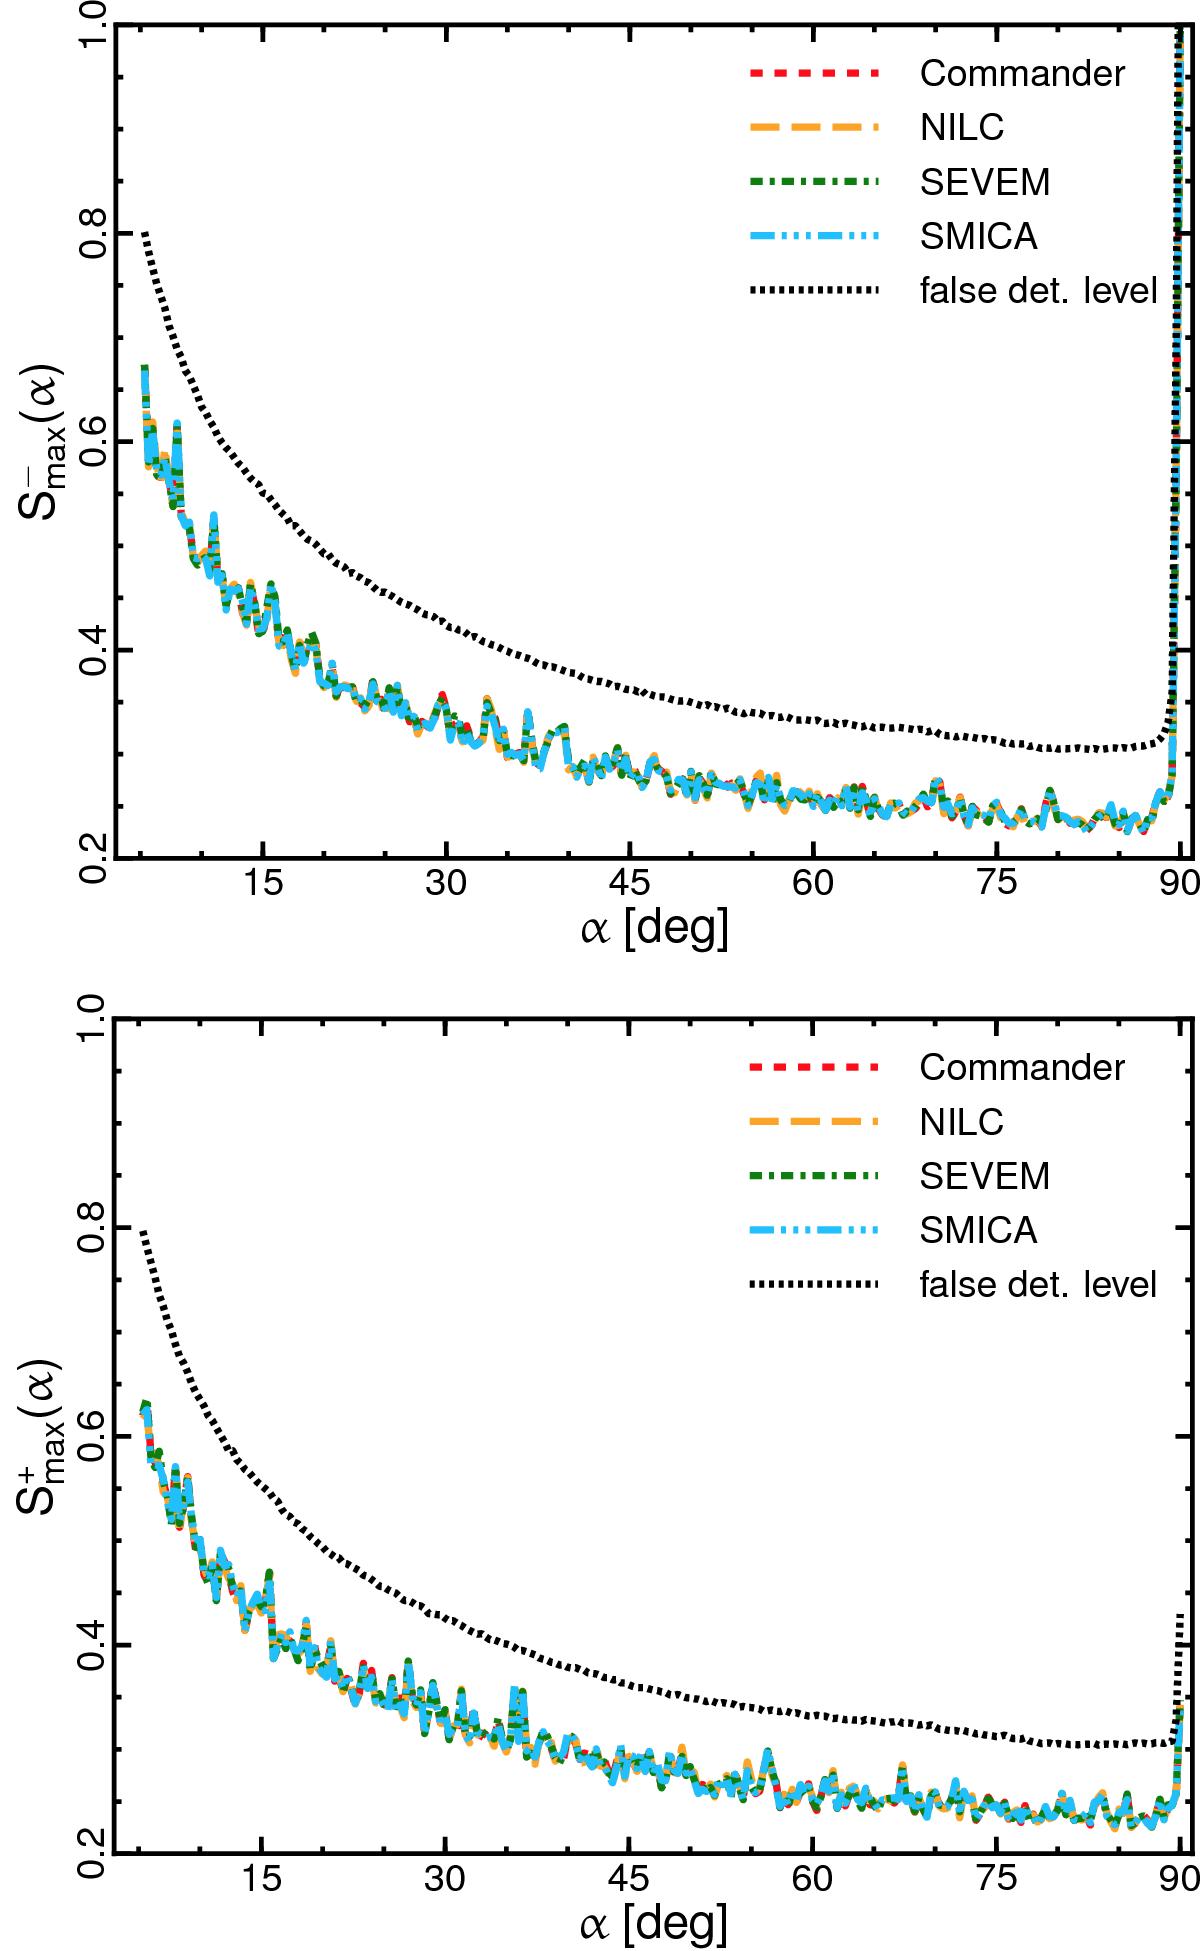
![]() (upper) and
(upper) and ![]() (lower) statistics as a function of circle radius α for the PlanckCommander (short-dashed red line), NILC (long dashed orange line), SEVEM (dot-dashed green line), and SMICA (three dot-dashed blue line) 2015 temperature maps. The dotted line shows the false detection level established such that fewer than 1% of 300 Monte Carlo simulations of the SMICA CMB temperature map, smoothed and masked in the same way as the data, would yield a false event. The peak at 90° corresponds to a match between two copies of the same circle of radius 90° centred around two antipodal points.
(lower) statistics as a function of circle radius α for the PlanckCommander (short-dashed red line), NILC (long dashed orange line), SEVEM (dot-dashed green line), and SMICA (three dot-dashed blue line) 2015 temperature maps. The dotted line shows the false detection level established such that fewer than 1% of 300 Monte Carlo simulations of the SMICA CMB temperature map, smoothed and masked in the same way as the data, would yield a false event. The peak at 90° corresponds to a match between two copies of the same circle of radius 90° centred around two antipodal points.
Current usage metrics show cumulative count of Article Views (full-text article views including HTML views, PDF and ePub downloads, according to the available data) and Abstracts Views on Vision4Press platform.
Data correspond to usage on the plateform after 2015. The current usage metrics is available 48-96 hours after online publication and is updated daily on week days.
Initial download of the metrics may take a while.