Fig. 9
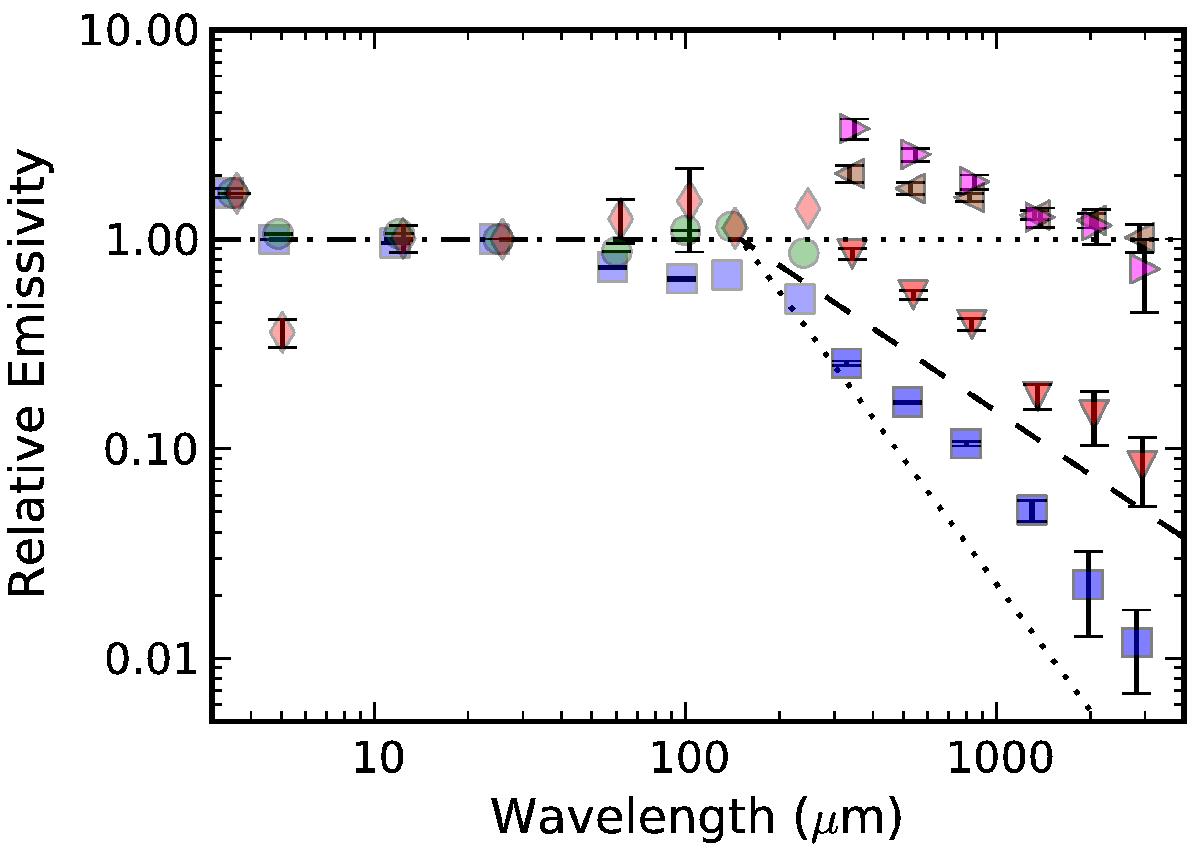
Zodiacal emissivities. Data on the left, at wavelengths shorter than about 300 μm, are from COBE/DIRBE (Kelsall et al. 1998). Data for wavelengths greater than about 300 μm are from Planck (Table 3). In both cases, the blue squares represent the emissivity of the Diffuse Cloud. For DIRBE, the red diamonds represent the fitted emissivity for all three IRAS Bands, and the green circles show the values for the Circumsolar Ring and Trailing Blob. For Planck: the pink right-pointing triangles are for IRAS Band 3; the brown left-pointing triangles are for IRAS Band 1; and the red downward-pointing triangles are for IRAS Band 2. For reference, the lines show emissivities that are unity at wavelengths less than 250 μm, but proportional to λ-2, λ-1, and λ0 at longer wavelengths.
Current usage metrics show cumulative count of Article Views (full-text article views including HTML views, PDF and ePub downloads, according to the available data) and Abstracts Views on Vision4Press platform.
Data correspond to usage on the plateform after 2015. The current usage metrics is available 48-96 hours after online publication and is updated daily on week days.
Initial download of the metrics may take a while.