Fig. 4
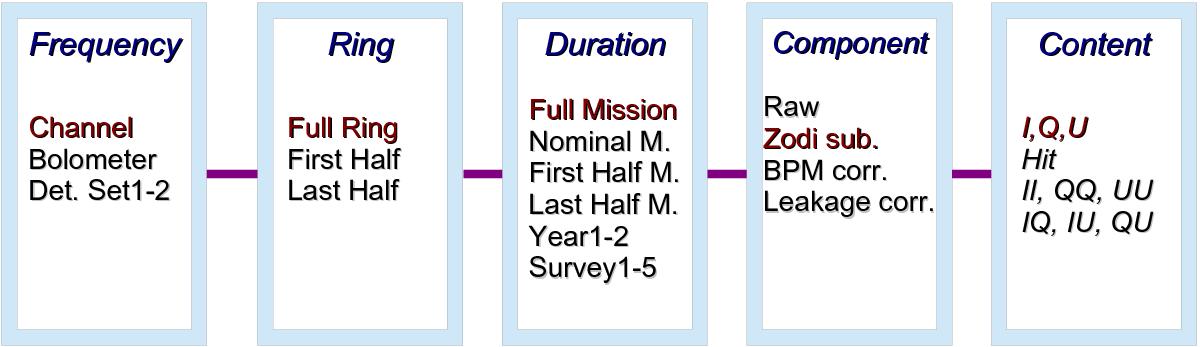
Map matrix. The HFI maps are released in different flavours. Not all combinations are released, but any map will correspond to a choice of lines in each box. The Frequency box is related to the use of all detectors at a given frequency (Channel), or individual bolometers, or sets of detectors as defined in Table A.1. The Ring box is a way of splitting (or not) the data in equal halves at the ring level. The Duration box indicates the different ways of splitting data between surveys: years, full or nominal mission, first half mission, or last half mission. The Component box indicates the systematic corrections that can be applied at the map level. The recommended first choice map is highlighted in red. See Appendix A for details.
Current usage metrics show cumulative count of Article Views (full-text article views including HTML views, PDF and ePub downloads, according to the available data) and Abstracts Views on Vision4Press platform.
Data correspond to usage on the plateform after 2015. The current usage metrics is available 48-96 hours after online publication and is updated daily on week days.
Initial download of the metrics may take a while.