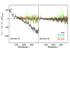
Fig. 16
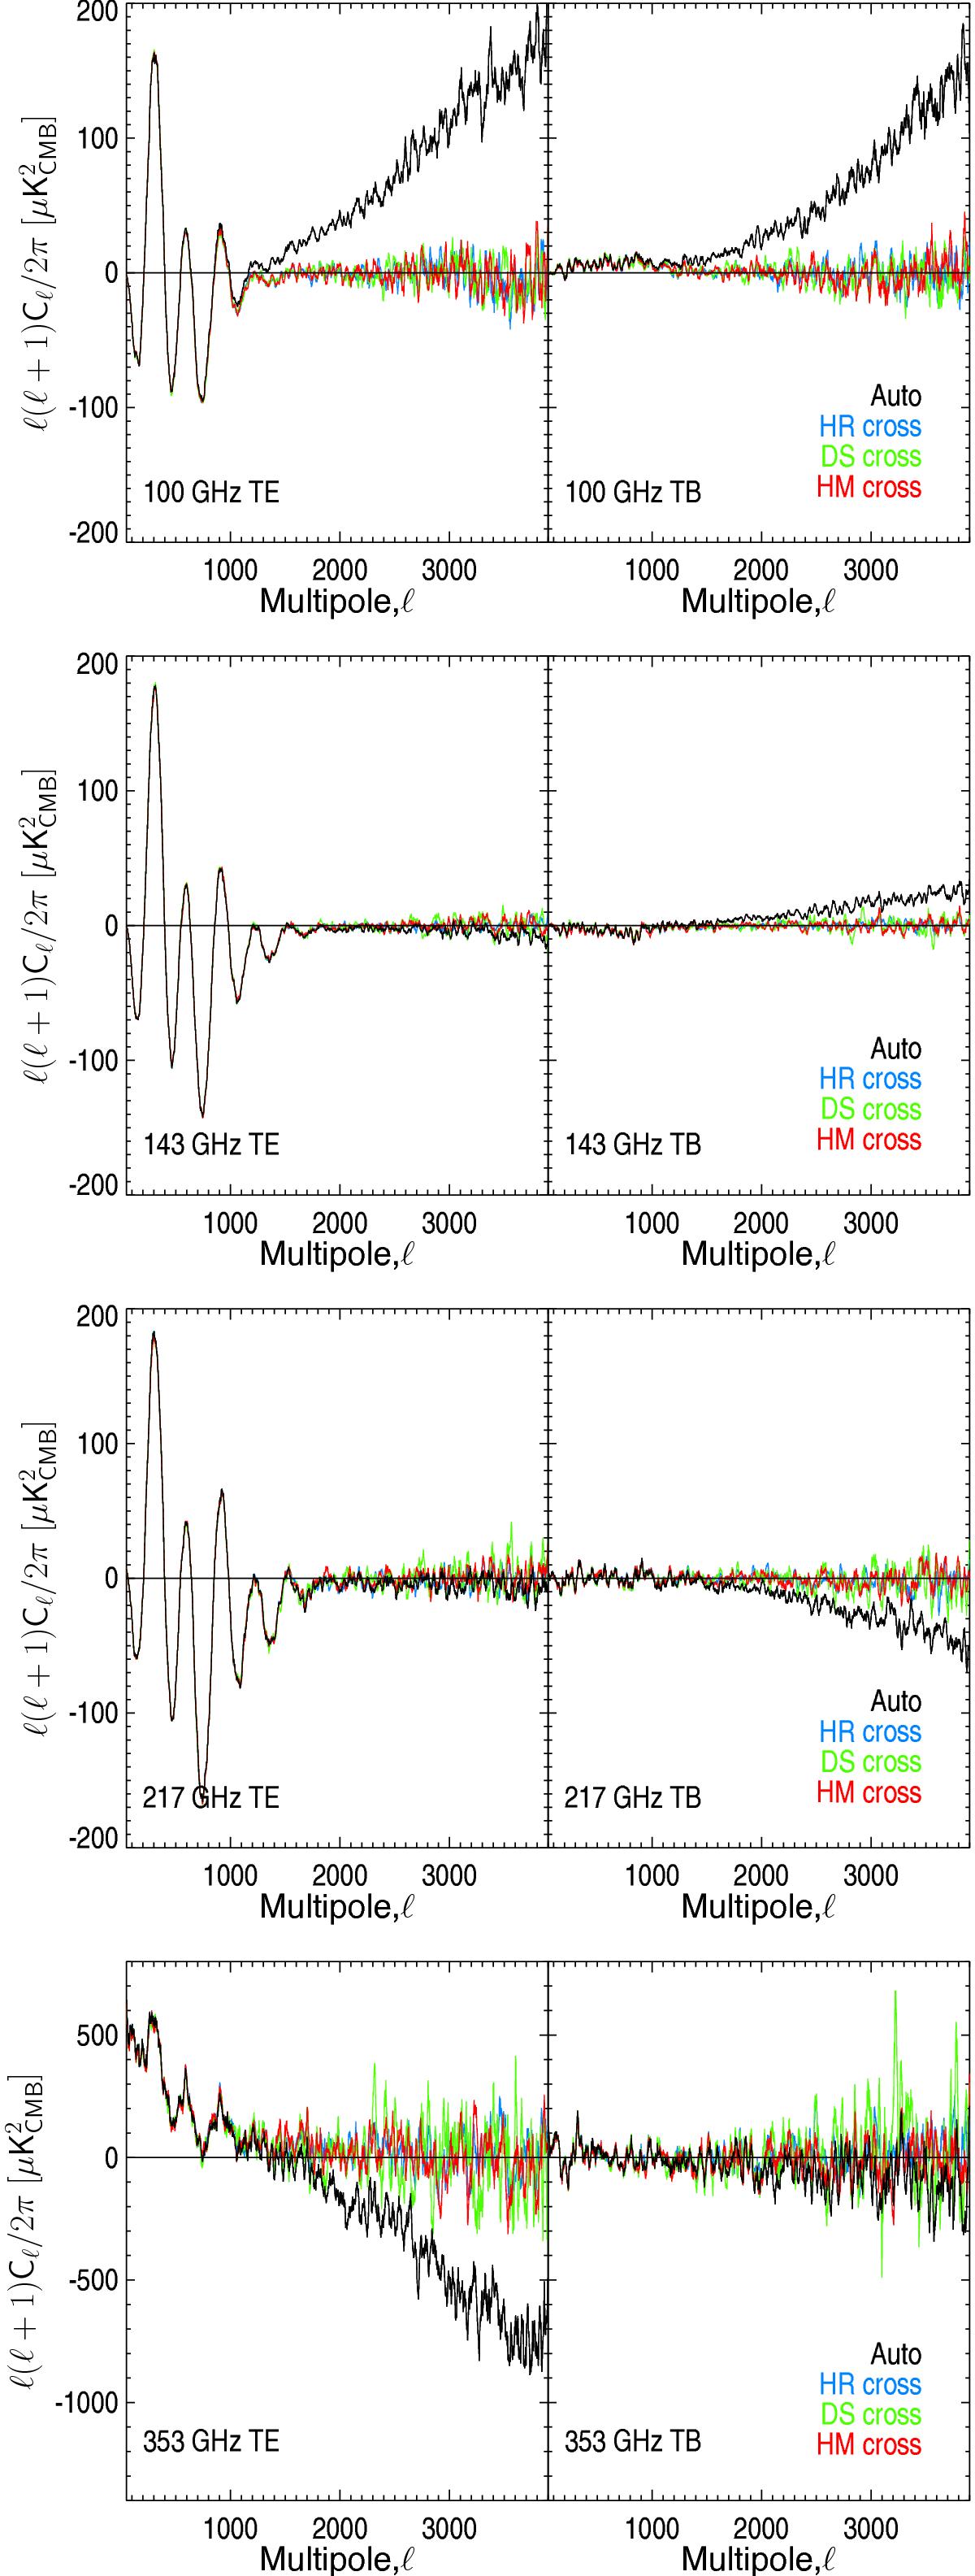
Pseudo-power spectra for TE (left) and TB (right) for each frequency (from top to bottom: 100, 143, 217, and 353 GHz). The auto-spectra are shown in black. Cross-spectra of half-ring (HR), half-mission (HM), and detector-set (DS) half-differences are shown in blue, red, and green, respectively. A Galaxy and point source mask, leaving 40% of the sky, was used in all cases.
Current usage metrics show cumulative count of Article Views (full-text article views including HTML views, PDF and ePub downloads, according to the available data) and Abstracts Views on Vision4Press platform.
Data correspond to usage on the plateform after 2015. The current usage metrics is available 48-96 hours after online publication and is updated daily on week days.
Initial download of the metrics may take a while.