Free Access
Fig. 12
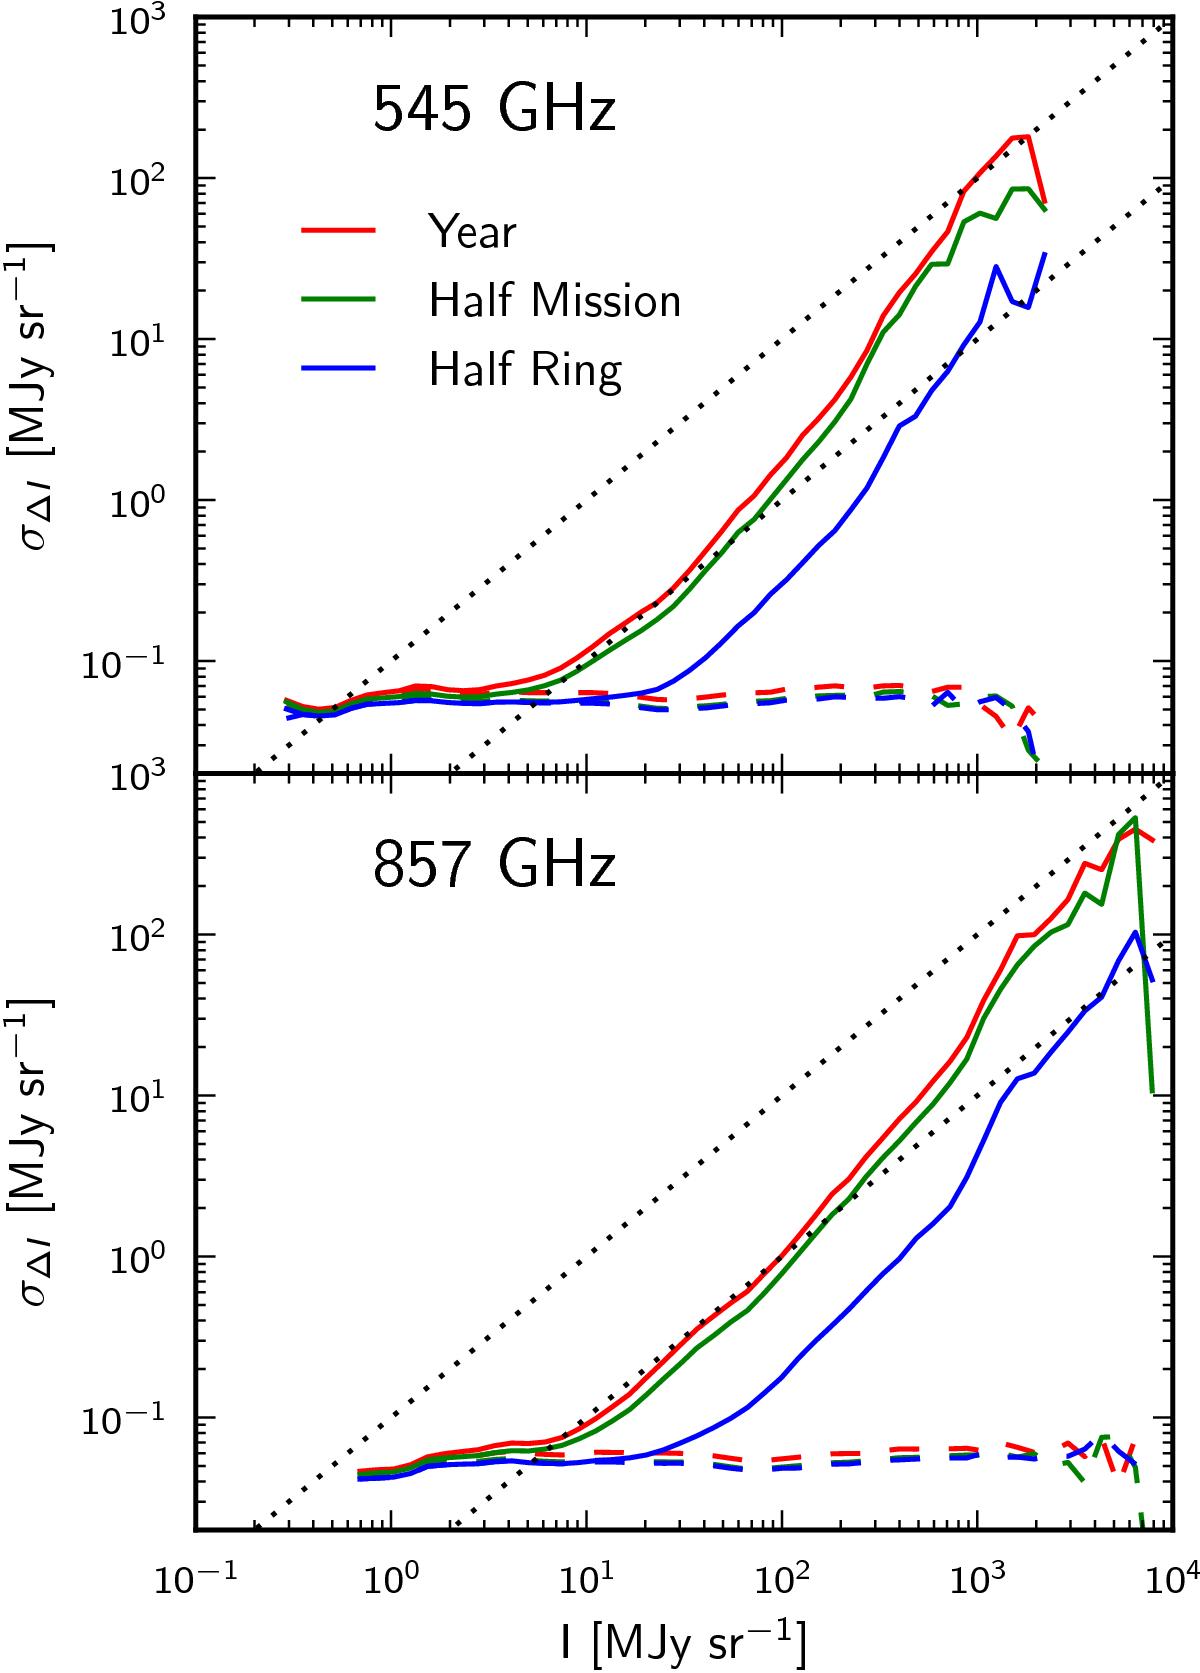
Root mean square of the residual signal in difference maps at 545 and 857 GHz, as a function of signal level in the full map. The solid coloured curves show the rms of the data, while dashed coloured curves show the rms of a simulated noise map. The diagonal dotted lines indicate 1% and 10% of the signal.
Current usage metrics show cumulative count of Article Views (full-text article views including HTML views, PDF and ePub downloads, according to the available data) and Abstracts Views on Vision4Press platform.
Data correspond to usage on the plateform after 2015. The current usage metrics is available 48-96 hours after online publication and is updated daily on week days.
Initial download of the metrics may take a while.