Free Access
Fig. 11
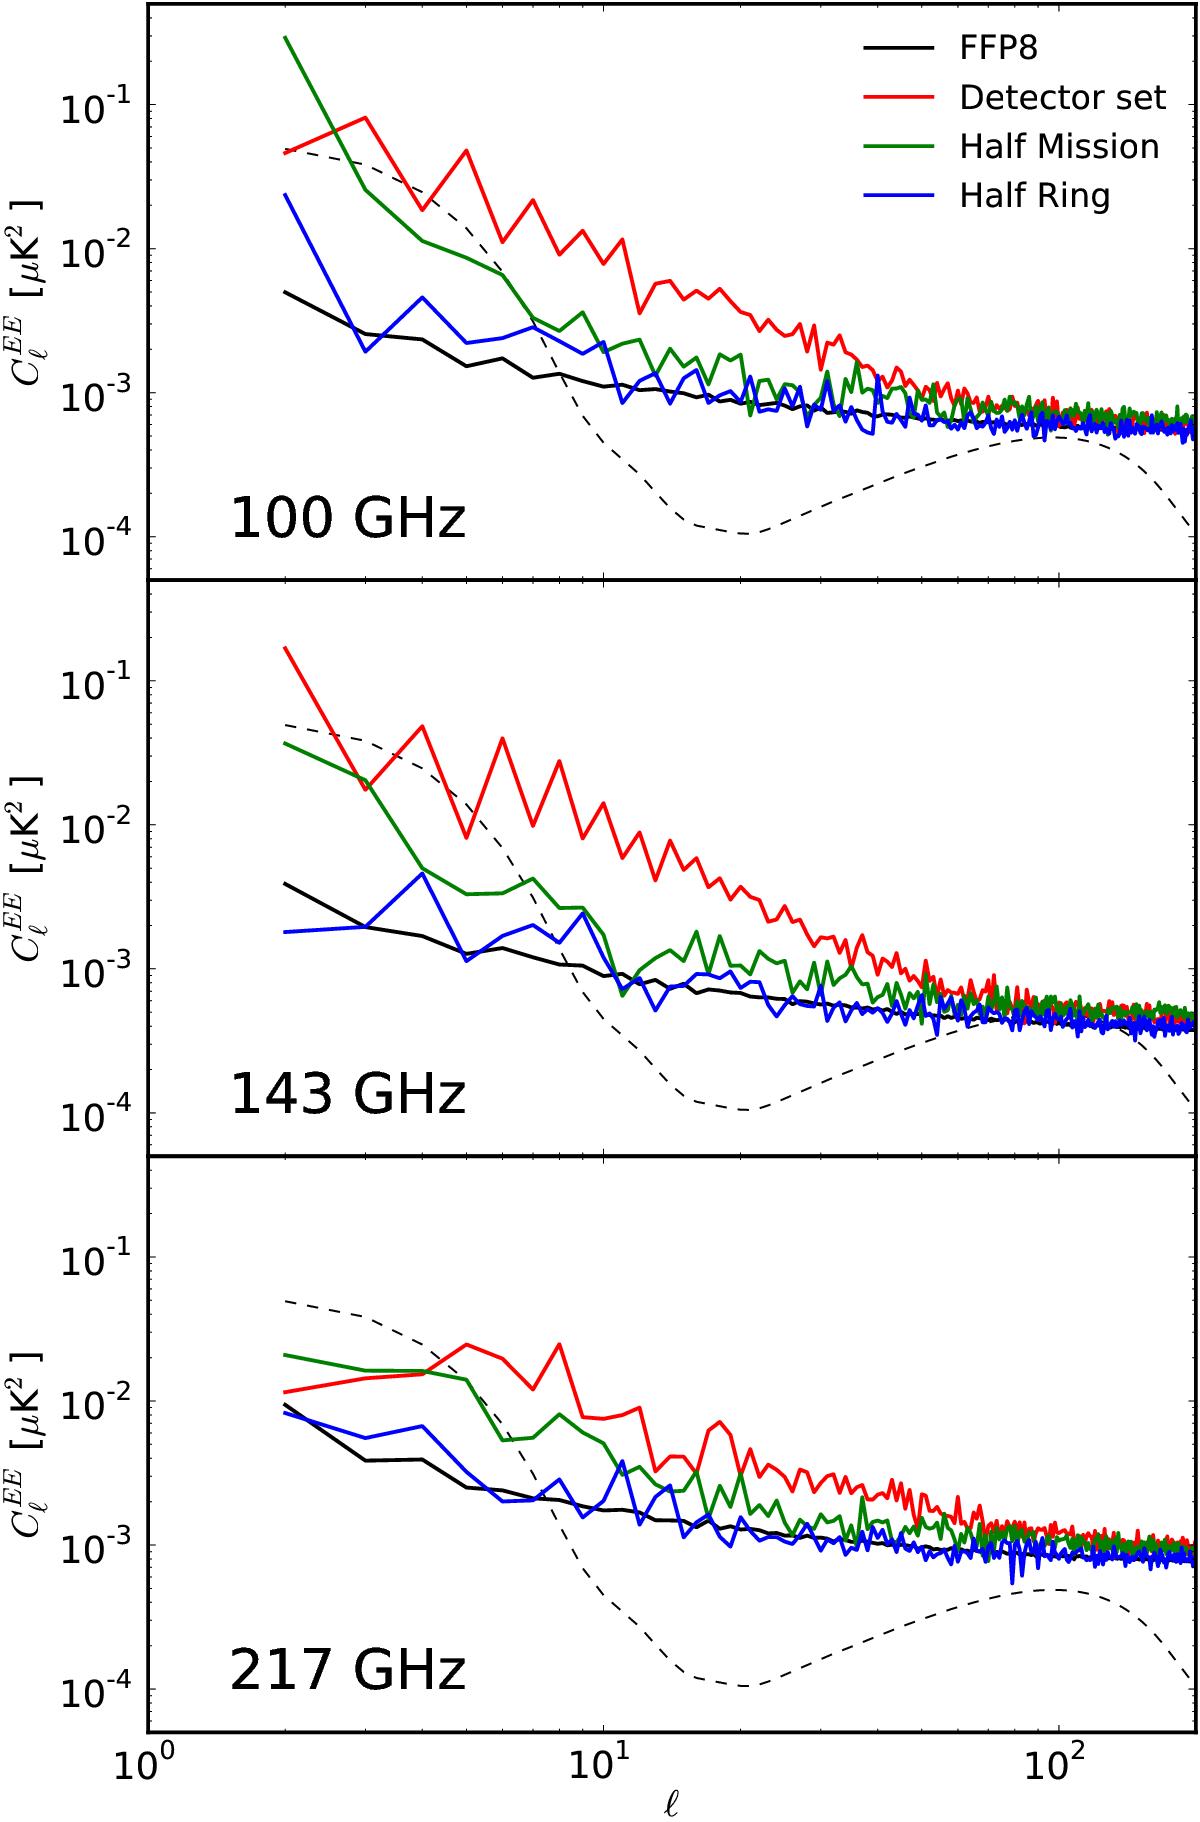
EE power spectra reconstructed from the half-difference between data subset maps for the dipole-calibrated channels at low multipoles compared to the noise estimation from the FFP8 simulations. CMB signal from Planck 2015 is plotted in dashed lines.
Current usage metrics show cumulative count of Article Views (full-text article views including HTML views, PDF and ePub downloads, according to the available data) and Abstracts Views on Vision4Press platform.
Data correspond to usage on the plateform after 2015. The current usage metrics is available 48-96 hours after online publication and is updated daily on week days.
Initial download of the metrics may take a while.