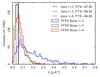
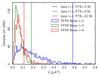
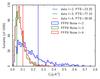
Fig. 24
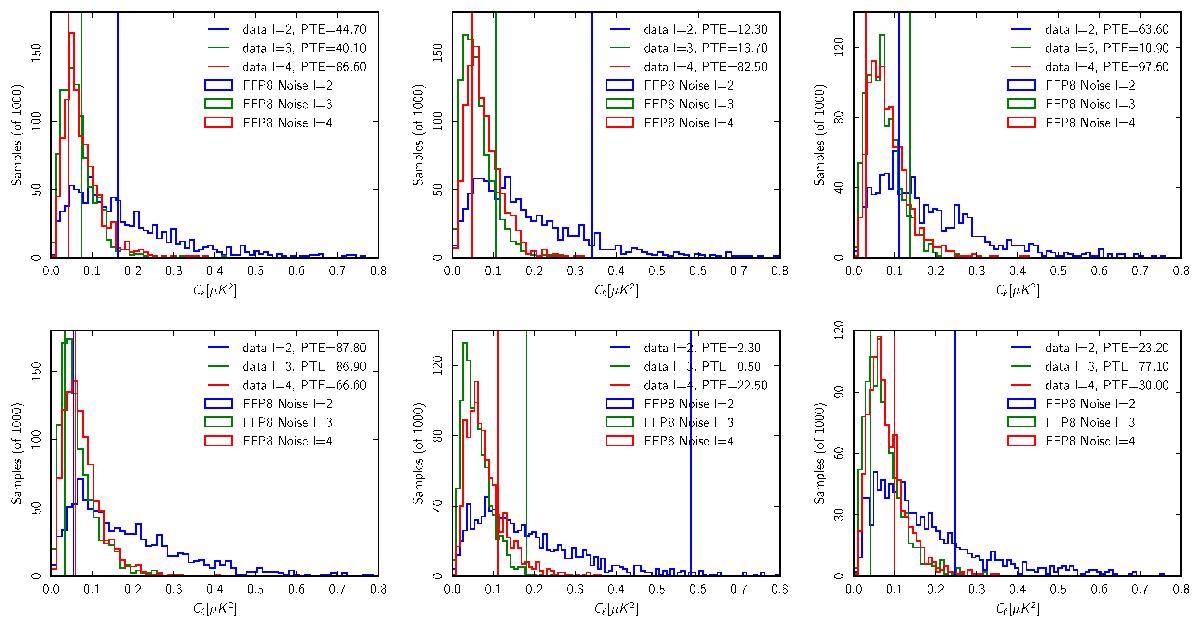
Measured LFI 70 GHz EE (top) and BB (bottom) null power spectra for ℓ = 2, 3, and 4 (vertical lines), compared to the distribution derived from noise-only Monte Carlo simulations. Null spectra from the difference between full data and specific surveys combinations: left Survey 1 and Survey 3; (middle) Survey 2 and Survey 4; and (right) Survey 5 and Survey 7. It is clear that Survey 2/Survey 4 stands out with respect to the others.
Current usage metrics show cumulative count of Article Views (full-text article views including HTML views, PDF and ePub downloads, according to the available data) and Abstracts Views on Vision4Press platform.
Data correspond to usage on the plateform after 2015. The current usage metrics is available 48-96 hours after online publication and is updated daily on week days.
Initial download of the metrics may take a while.