Free Access
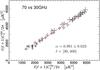
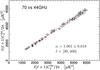
Fig. 21
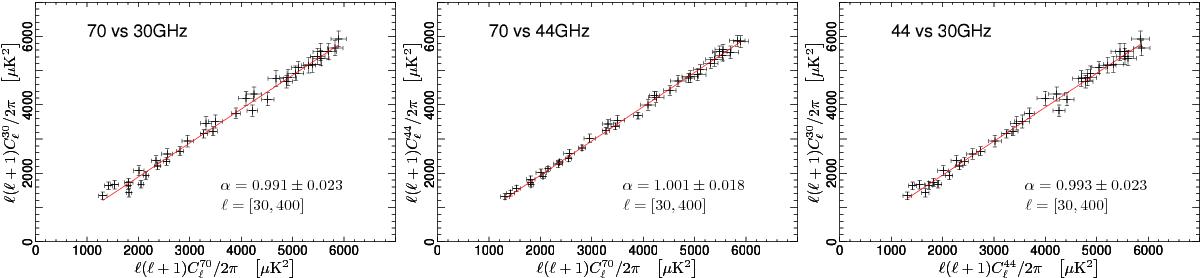
Consistency between cross-power spectra at LFI frequencies: left 70 GHz versus 30 GHz; middle 70 GHz versus 44 GHz; and right 44 GHz versus 30 GHz. The solid red line is the linear regression, accounting for error on both axes. Slope values are found to be consistent within the uncertainties.
This figure is made of several images, please see below:
Current usage metrics show cumulative count of Article Views (full-text article views including HTML views, PDF and ePub downloads, according to the available data) and Abstracts Views on Vision4Press platform.
Data correspond to usage on the plateform after 2015. The current usage metrics is available 48-96 hours after online publication and is updated daily on week days.
Initial download of the metrics may take a while.