Fig. 2
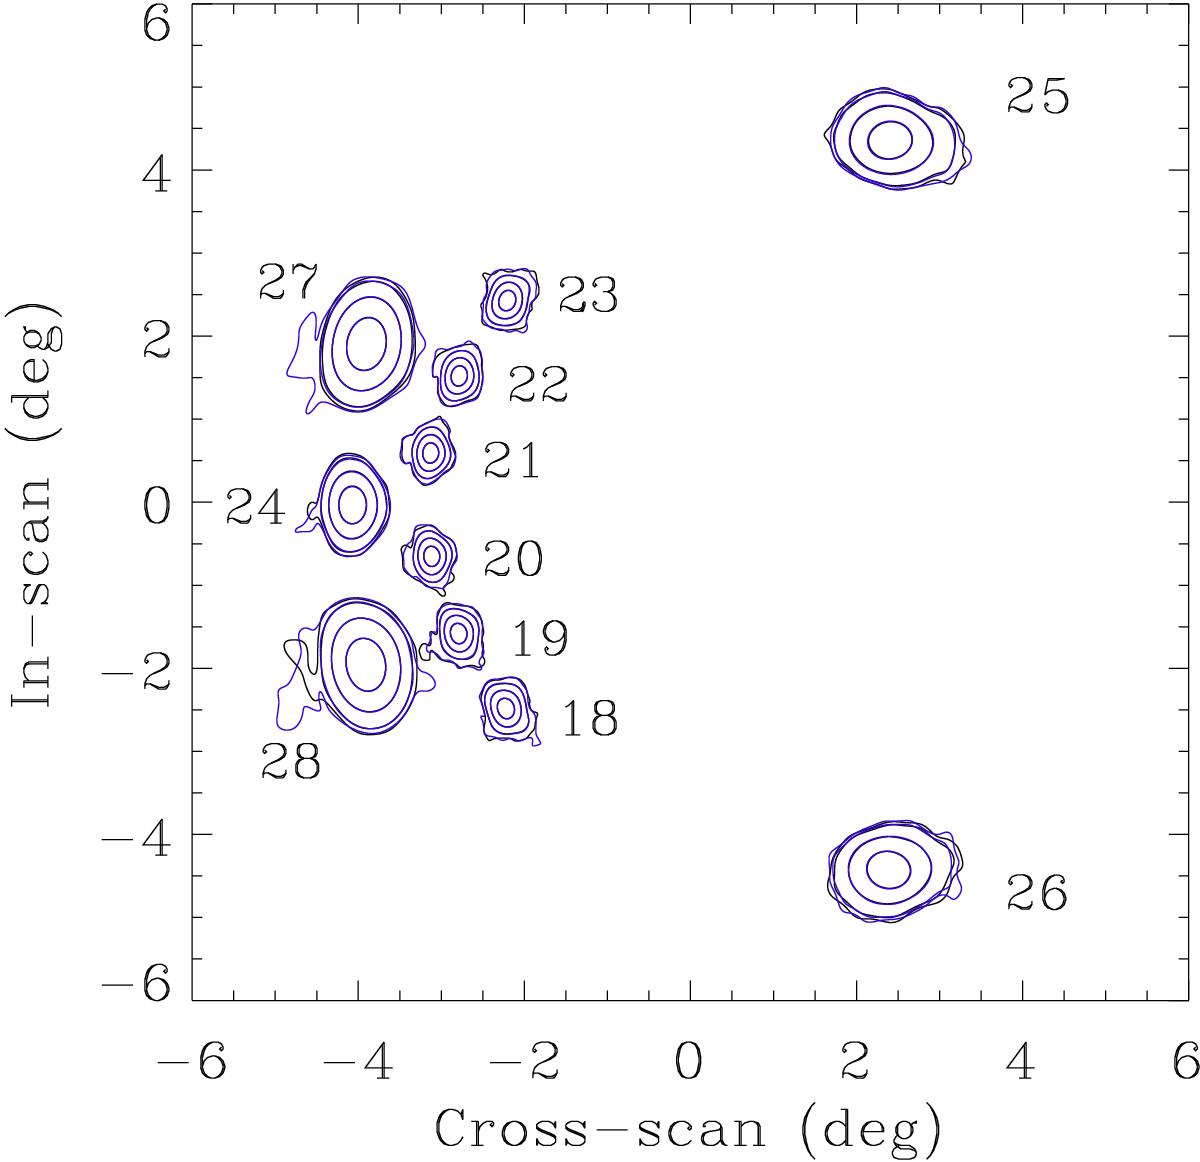
Scanning beams reconstructed from Jupiter observations. The beams are plotted in logarithmic contours of −3, −10, −20, and −30 dB from the peak, for the 70 GHz channel (horns 18–23), and −3, −10, −20, and −25 dB from the peak, for the 30 and 44 GHz channel (horns 27 and 28, and 24–26, respectively). The main and side arms are indicated with black and blue lines, respectively.
Current usage metrics show cumulative count of Article Views (full-text article views including HTML views, PDF and ePub downloads, according to the available data) and Abstracts Views on Vision4Press platform.
Data correspond to usage on the plateform after 2015. The current usage metrics is available 48-96 hours after online publication and is updated daily on week days.
Initial download of the metrics may take a while.