Free Access
Fig. 15
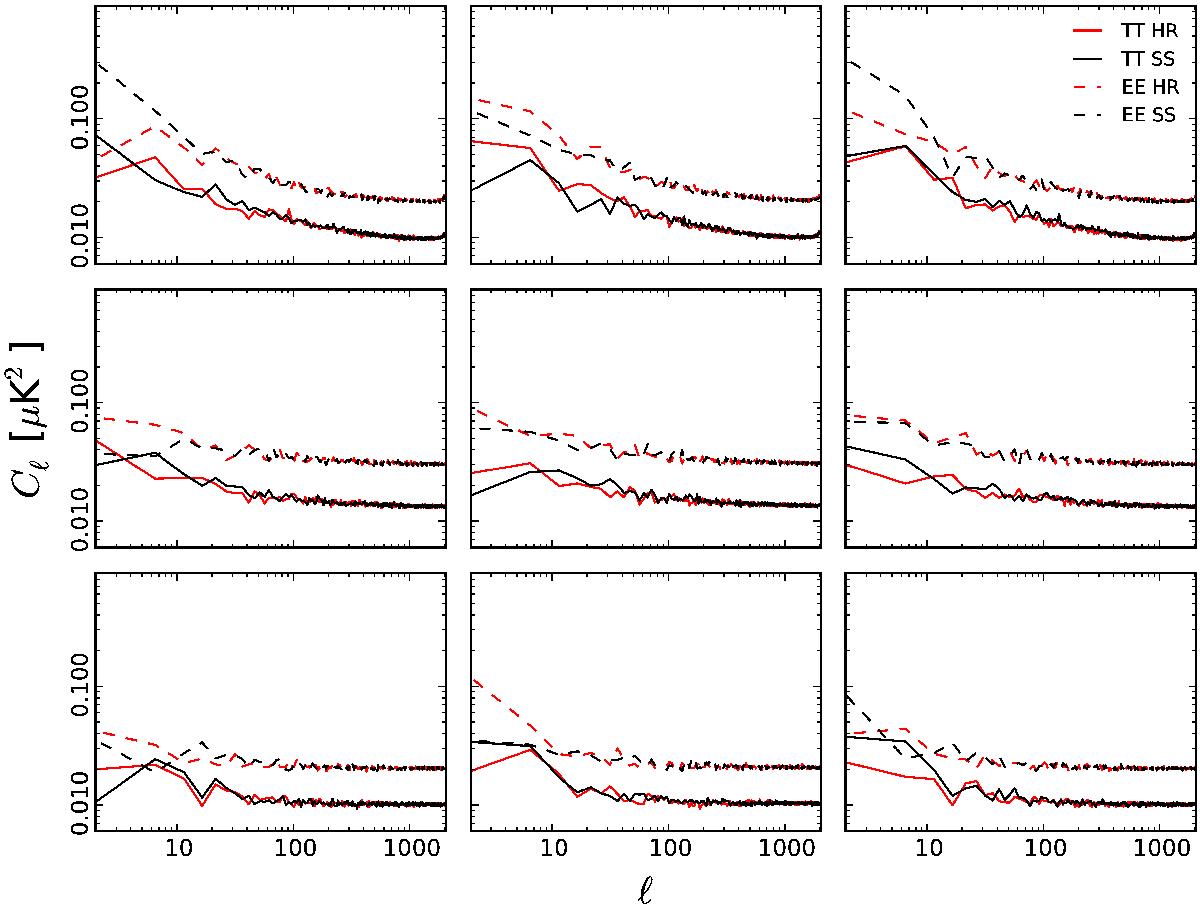
Null test results comparing power spectra from survey differences to those from the half-ring maps. Differences are: left Survey 1 − Survey 2; middle Survey 1 − Survey 3; and right Survey 1 − Survey 4. These are shown for 30 GHz (top), 44 GHz (middle), and 70 GHz (bottom) for both TT and EE power spectra.
Current usage metrics show cumulative count of Article Views (full-text article views including HTML views, PDF and ePub downloads, according to the available data) and Abstracts Views on Vision4Press platform.
Data correspond to usage on the plateform after 2015. The current usage metrics is available 48-96 hours after online publication and is updated daily on week days.
Initial download of the metrics may take a while.