Free Access
Fig. 14
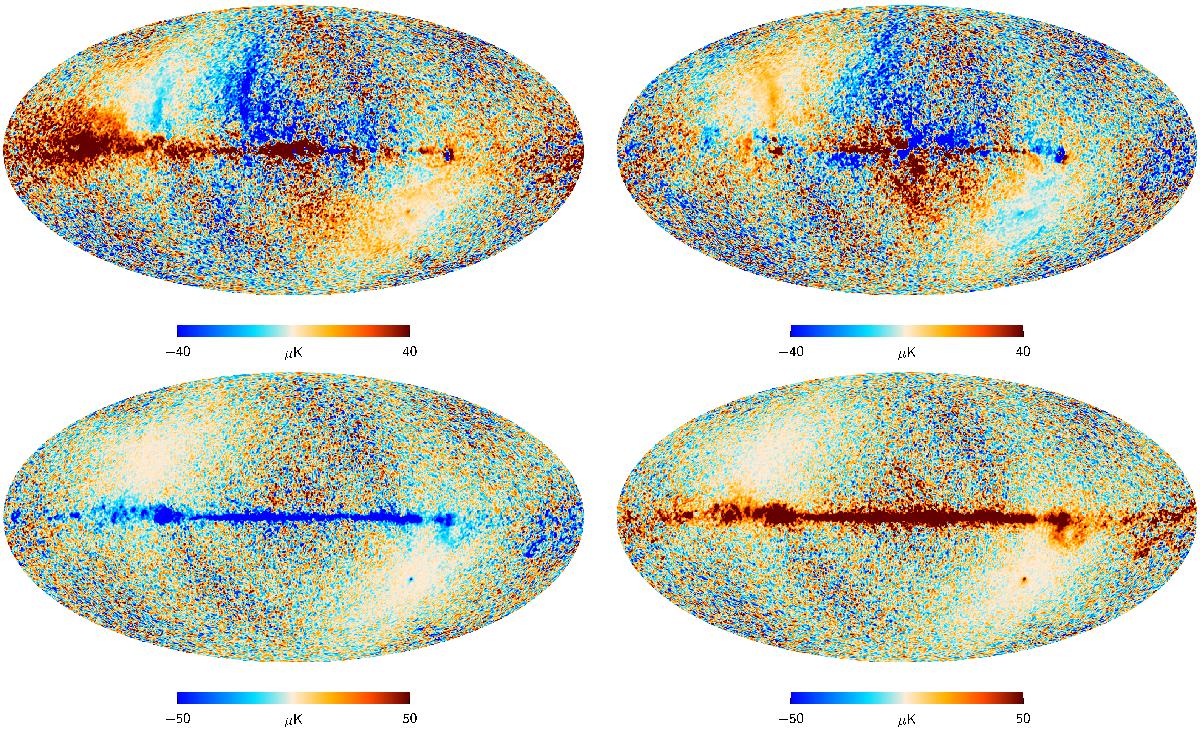
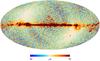
IQUSS solution maps at 30 GHz. Top left: Stokes Q. Top right: Stokes U. Bottom left: spurious signal from the first RCA, S1. Bottom right: spurious signal from the second RCA, S2. Polarization maps are noisier than the usual mapmaking solution, since S1 and S2 have to be extracted from the same data.
This figure is made of several images, please see below:
Current usage metrics show cumulative count of Article Views (full-text article views including HTML views, PDF and ePub downloads, according to the available data) and Abstracts Views on Vision4Press platform.
Data correspond to usage on the plateform after 2015. The current usage metrics is available 48-96 hours after online publication and is updated daily on week days.
Initial download of the metrics may take a while.