Free Access
Fig. 9
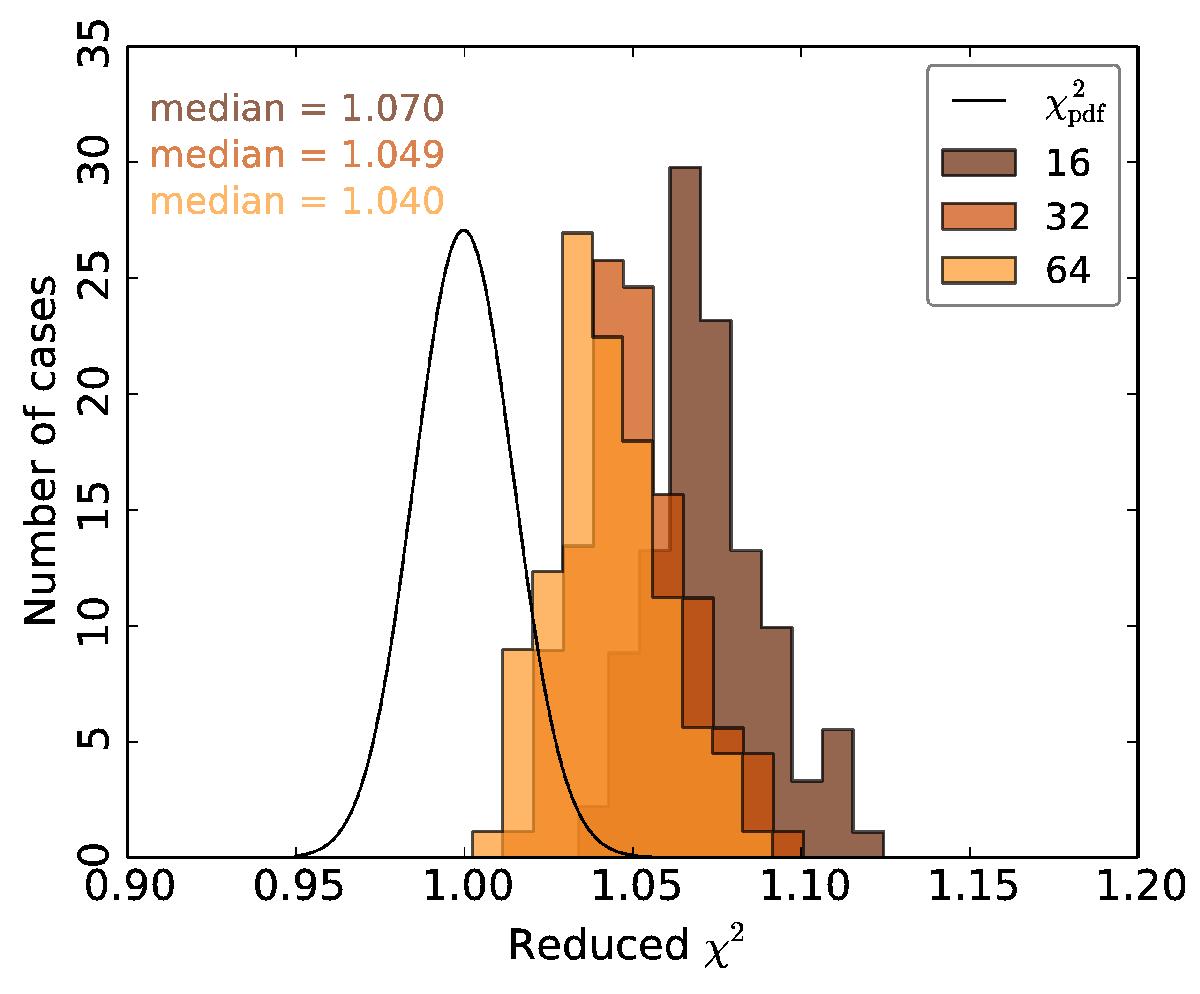
Reduced χ2 statistics for simulated full-mission 30-GHz data. The initial resolution of the noise covariance matrix is varied from Nside = 16 to 64 (220′ to 55′). In all cases the covariance matrix is eventually downgraded to resolution Nside = 16 and compared against simulated maps at this resolution.
Current usage metrics show cumulative count of Article Views (full-text article views including HTML views, PDF and ePub downloads, according to the available data) and Abstracts Views on Vision4Press platform.
Data correspond to usage on the plateform after 2015. The current usage metrics is available 48-96 hours after online publication and is updated daily on week days.
Initial download of the metrics may take a while.