Free Access
Fig. 18
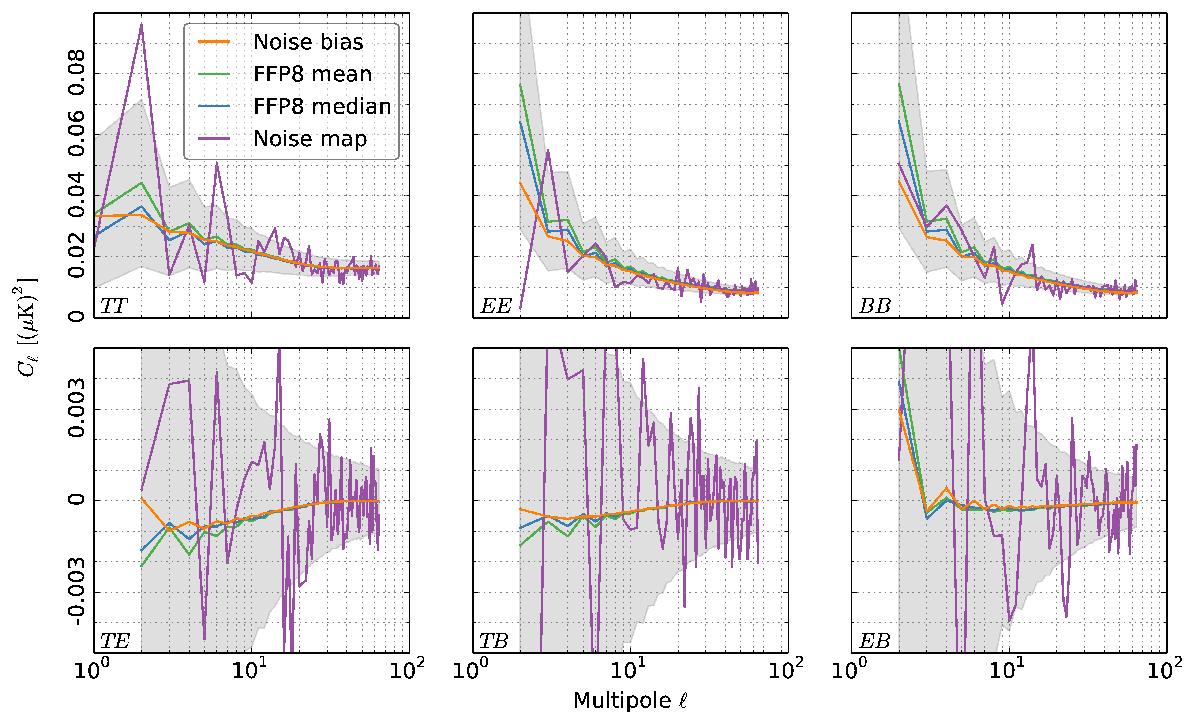
Noise bias levels at 30 GHz. Noise bias from the 2015 full-mission noise covariance matrix is plotted in orange. The noise MC statistics from 10 000 FFP8 simulations are plotted in green (for the mean), blue (median) and grey (± 1σ region), as well as the noise estimate of the half ring noise map in purple.
Current usage metrics show cumulative count of Article Views (full-text article views including HTML views, PDF and ePub downloads, according to the available data) and Abstracts Views on Vision4Press platform.
Data correspond to usage on the plateform after 2015. The current usage metrics is available 48-96 hours after online publication and is updated daily on week days.
Initial download of the metrics may take a while.