Fig. 16
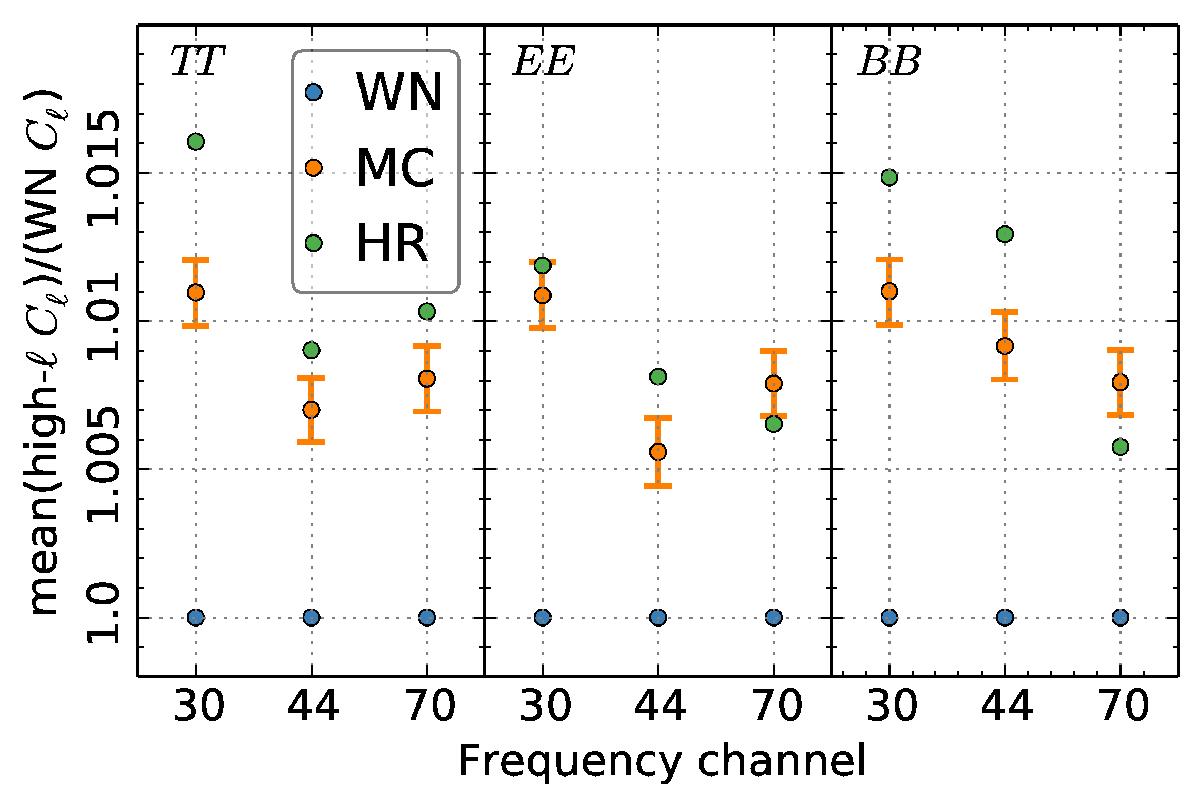
Comparison of noise estimates at high multipoles, as a ratio of the full noise level and the white noise level (blue). The green dots show the estimate from half-ring maps. The orange dots show the mean of 10 000 Monte Carlo simulations. The error bars here include the statistical variation only. The values shown are mean values of the noise spectrum in the range ℓ = 1150−1800. The absolute white noise levels in μK2 are reported in the last two columns of Table 7.
Current usage metrics show cumulative count of Article Views (full-text article views including HTML views, PDF and ePub downloads, according to the available data) and Abstracts Views on Vision4Press platform.
Data correspond to usage on the plateform after 2015. The current usage metrics is available 48-96 hours after online publication and is updated daily on week days.
Initial download of the metrics may take a while.