Fig. 1
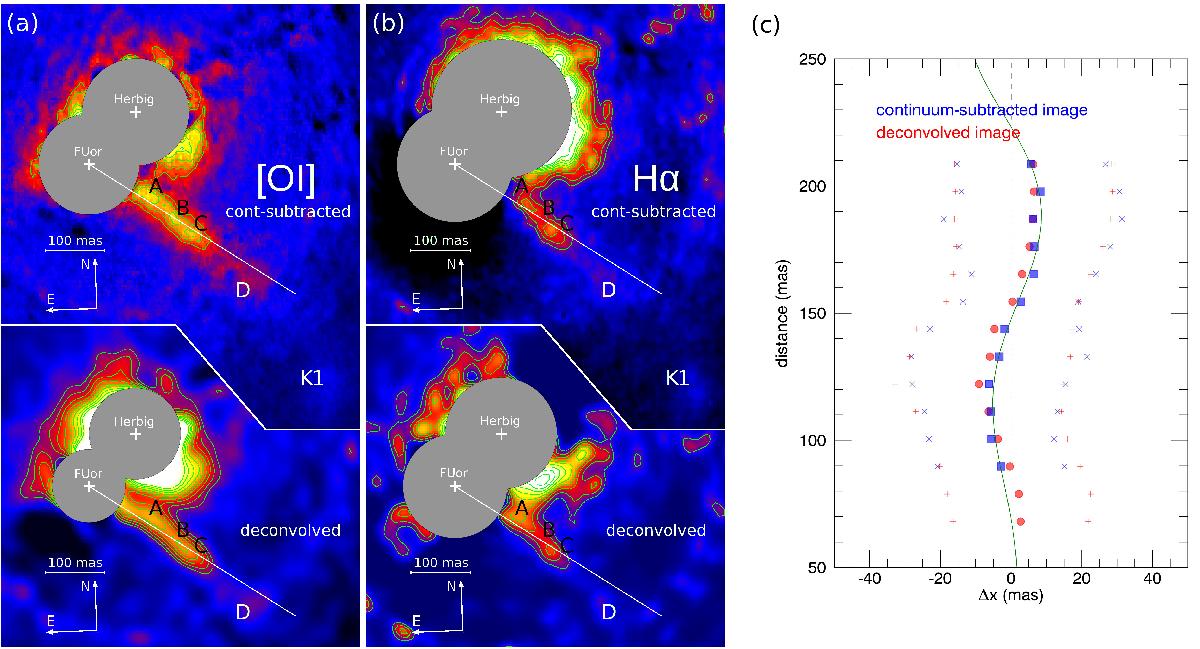
a)Continuum-subtracted (top) and deconvolved (bottom) [O i] images of the Z CMa system. The deconvolved image shows only the diffuse emission as reconstructed by the MC-RL algorithm. The centroids of the two stars and the position of the main knots of the FUor jet are indicated. Areas heavily corrupted by artefacts around the star centroids have been masked. b) Same for the Hα observations. c) Fitted transverse positions of the peak of the FUor jet spatial profile as a function of the distance from the exciting source for both the [O i] continuum-subtracted (blue squares) and deconvolved images (red circles). Blue crosses and red pluses indicate the measured profile width of the two images. The solid green line is the best fit of the wiggle produced by an orbital motion of the jet source around a companion (Anglada et al. 2007) to the peaks of the continuum-subtracted image.
Current usage metrics show cumulative count of Article Views (full-text article views including HTML views, PDF and ePub downloads, according to the available data) and Abstracts Views on Vision4Press platform.
Data correspond to usage on the plateform after 2015. The current usage metrics is available 48-96 hours after online publication and is updated daily on week days.
Initial download of the metrics may take a while.