| Issue |
A&A
Volume 593, September 2016
|
|
|---|---|---|
| Article Number | A17 | |
| Number of page(s) | 12 | |
| Section | Extragalactic astronomy | |
| DOI | https://doi.org/10.1051/0004-6361/201628861 | |
| Published online | 30 August 2016 | |
Probing dust-obscured star formation in the most massive gamma-ray burst host galaxies⋆
1
Max-Planck-Institut für extraterrestrische Physik,
85740 Garching, Giessenbachstr. 1,
Germany
e-mail: This email address is being protected from spambots. You need JavaScript enabled to view it.
2 Scottish Universities Physics
Alliance, Institute for Astronomy, University of Edinburgh, Royal
Observatory, Edinburgh, EH9
3hJ, UK
3 Thüringer Landessternwarte
Tautenburg, Sternwarte
5, 07778
Tautenburg,
Germany
4 INAF–Osservatorio Astrofisico di
Arcetri, Largo E. Fermi
5, 50125
Firenze,
Italy
5 Sterrenkundig Observatorium,
Universiteit Gent, Krijgslaan
281, 9000
Gent,
Belgium
6 Department of Physics and
Astrophysics, Vrije Universiteit Brussel, Pleinlaan 2, 1050
Brussels,
Belgium
7 CSIRO Astronomy & Space Science,
Australia Telescope National Facility, PO Box 76, 1710
Epping,
Australia
8 National Centre for Radio
Astrophysics, TIFR, Ganeshkind, 411007
Pune,
India
9 Instituto de Astrofísica de
Andalucía-CSIC, Glorieta de la
Astronomía, s/n, 18008
Granada,
Spain
10 CSIRO Astronomy & Space
Science, Locked Bag 194, 2390
Narrabri,
Australia
11 Astrophysics Data System,
Harvard-Smithonian Center for Astrophysics, Garden St. 60,
Cambridge, MA
02138,
USA
12 Universidad de Valparaıso,
Instituto de Física y Astronomía, Gran Bretana 1111, Valparaıso, Chile
13 INAF, Institute of Space
Astrophysics and Cosmic Physics, via P. Gobetti 101, 40129
Bologna,
Italy
14 Physics Dept., University of
Calabria, via P.
Bucci, 87036
Arcavacata di Rende,
Italy
Received:
5
May
2016
Accepted:
24
June
2016
Abstract
Context. As a result of their relation to massive stars, long-duration gamma-ray bursts (GRBs) allow the pinpointing of star formation in galaxies independent of redshift, dust obscuration, or galaxy mass/size, thus providing a unique tool to investigate star formation history over cosmic time.
Aims. About half of the optical afterglows of long-duration GRBs are missed owing to dust extinction and are primarily located in the most massive GRB hosts. It is important to investigate the amount of obscured star formation in these GRB host galaxies to understand this bias.
Methods. Radio emission of galaxies correlates with star formation, but does not suffer extinction as do the optical star formation estimators. We selected 11 GRB host galaxies with either large stellar mass or large UV-based and optical-based star formation rates (SFRs) and obtained radio observations of these with the Australia Telescope Compact Array and the Karl Jansky Very Large Array.
Results. Despite intentionally selecting GRB hosts with expected high SFRs, we do not find any radio emission related to star formation in any of our targets. Our upper limit for GRB 100621A implies that the earlier reported radio detection was due to afterglow emission. We detect radio emission from the position of GRB 020819B, but argue that it is in large part, if not completely, due to afterglow contamination.
Conclusions. Half of our sample has radio-derived SFR limits, which are only a factor 2–3 above the optically measured SFRs. This supports other recent studies that the majority of star formation in GRB hosts is not obscured by dust.
Key words: galaxies: star formation / radio continuum: galaxies / gamma-ray burst: general
Based on observations collected with ATCA under ID C2718, and at VLA under ID 13B-017.
© ESO, 2016
1. Introduction
Gamma-ray bursts (GRBs) are short flashes of high-energy photons that, for the brief moment of their existence, are the brightest sources in the γ-ray sky. Present technology is able to detect ≈3 GRBs per day, out to the most distant corners of the Universe. Not surprisingly, GRBs have been established as a new observational tool for stellar astrophysics, relativistic hydrodynamics, black hole formation, cosmology, gravitational-wave astronomy, cosmic-ray physics, and neutrino astronomy.
Two GRB populations exist: those of long duration and short duration. Although their formation mechanisms differ, at their essence lies the formation of stellar-mass black holes with an accretion disk. Optical spectroscopy has conclusively linked long-duration GRBs (LGRBs) with supernovae, whose parameters (expansion velocities and energetics) suggest the explosion of a massive star (Hjorth et al. 2003; Stanek et al. 2003). Thus, LGRBs have recently been used to infer the cosmic evolution of the star formation rate density (SFRD) up to z~ 9 (Butler et al. 2010; Elliott et al. 2012; Kistler et al. 2009; Robertson & Ellis 2012; Yüksel et al. 2008). This was possible because GRBs enable the identification of galaxies essentially independent of their luminosity or dust obscuration, thus singling out a population that is a potentially powerful probe of galaxy evolution. Hence, galaxies hosting LGRBs (GRBHs) may help fill the incompleteness in the SFRD, especially at the very high redshifts not easily explored with current techniques.
However, to use the GRB rate to trace SFRD in the distant Universe, we first need to understand the relation at low redshift and to investigate any possible biases that could distort the proportionality between the two. Since bright highly star-forming dusty sub-millimetre galaxies (SMGs) contribute 20% to the SFRD at z ~ 2−4 (Michałowski et al. 2010; Perley & Perley 2013), one might expect a similar fraction of GRBs to explode in such galaxies. Indeed, the analysis of GRBs along dusty sightlines, made possible only in recent years by systematic near-infrared (NIR) observations of GRB afterglows, has revealed a class of GRBH that are substantially more massive, evolved, and metal-rich and that have higher SFRs (Krühler et al. 2011; Hunt et al. 2011; Rossi et al. 2012; Perley et al. 2015) than previous samples of hosts of optically bright afterglows (e.g., Savaglio et al. 2009). We emphasize that these GRBHs are apparently typical hosts at z ≳ 1; they are not extreme examples, as a significant fraction (≈20−30%, see below) of GRB hosts are massive. Indeed, recent new statistical samples of GRBs and their host galaxies imply that the predominance of low-metallicity, low-mass GRBHs (Le Floc’h et al. 2003), which are common at z ~ 1, results from a variety of selection effects (Hjorth et al. 2012; Elliott et al. 2012; Perley et al. 2016). Also, metal-rich hosts have been found at high redshift (Savaglio et al. 2012), however, this does not imply that there is no metallicity dependence. At small redshifts, z ≲ 1.5, the overall GRB host population shows a significant aversion to massive systems (Perley et al. 2013). This preference for low-mass hosts at lower redshifts could be explained by a strong metallicity dependence. Based on the mass-metallicity relation, Perley et al. (2015) suggest a cutoff around solar metallicity, while spatially resolved spectroscopy hints at an even lower metallicity cutoff (Graham & Fruchter 2016). Above redshift of around three, this metallicity dependence is not noticable anymore (Greiner et al. 2015), since the mean metallicity everywhere is well below solar. Thus, the true host galaxy population over cosmic time is more varied (as might be expected given the evolution of the Universe), and there are indications that high-mass, metal-rich, dusty galaxies undergoing major bursts of star formation may contribute to the GRBH population, in particular at redshifts > 2.
Observation log of the GRB host sample.
Observations at radio wavelengths provide an unobscured view on star-forming galaxies by directly tracking recent (≲100 Myr) star formation activity through synchrotron radiation emitted by relativistic electrons accelerated in supernova remnants (Condon 1992). Even though the radio emission accounts for only a fraction of the bolometric luminosity of a galaxy, it is well correlated with the infrared emission, which is a good tracer of both the SFR and the dust mass in a galaxy.
Nearly 100 GRBHs of long-duration GRBs have so far been observed at radio frequencies, down to limits between 3−500 μJy (Berger et al. 2003; Michałowski et al. 2009; Stanway et al. 2010; Hatsukade et al. 2012; Michałowski et al. 2012; Perley 2012; Michałowski et al. 2014; Stanway et al. 2014; Michałowski et al. 2015; Perley et al. 2015; Stanway et al. 2015), but only 15 detections have been reported so far (not counting afterglows; Table 3). The early discovery of a few hosts at z ~ 1−2 with fluxes in the 100−200 μJy level had initially spurred interest, but these turned out to be exceptions with only two hosts added over the last 5−8 yr (with the exception of z < 0.1 objects). These two hosts are GRB 080207 (Perley 2012), which is an exceptionally dusty system, even compared with other massive, dusty GRB hosts, e.g., Hunt et al. (2011), Svensson et al. (2012), and GRB 021211 (Michałowski et al. 2012).
Assuming that the radio emission is powered by starbursts, these first detections implied a SFR of order a few hundred to thousand solar masses per year. This has been considered plausible, as the SFR determination based on UV/optical data would only measure the unobscured SFR. The difference in UV-to-radio SFR amounts to two orders of magnitude in some cases.
However, the many radio upper limits collected over the last years have resulted in radio-SFR limits of order 10−50 M⊙/yr, with some reaching close to the optically determined SFR values of order a few M⊙/yr. Particularly worth mentioning is a systematic search for radio emission at z < 1 GRBHs, where the mean 3σ flux limit of the 19 undetected hosts is < 35 μJy, corresponding to an average SFR< 15 M⊙/yr (Michałowski et al. 2012). This suggests that the GRB host population is similar to other star-forming galaxies at z ≳1.
In order to test the idea that a significant fraction of star formation in high-z GRBHs is obscured, we have undertaken radio continuum observations of GRBHs in the redshift range 0.5−2. We report on our observations of 12 GRB host galaxies with the Australia Telescope Compact Array (ATCA) and the Karl G. Jansky Very Large Array (VLA). Section 2 describes the selection criteria imposed on the sample of GRB hosts as well as the observations. Section 3 reports the results, and Sect. 4 gives our best interpretation.
2. Selection criteria, observations, and data analysis
We concentrate exclusively on hosts of LGRBs that have (i) a well-detected host galaxy; (ii) an accurately determined redshift; (iii) either multiband photometry to at least the rest-frame NIR such that the galaxy mass and SFR, if rest-frame UV was covered, have been measured; or (iv) optical spectroscopy of the host galaxy that allowed us to estimate the SFR from emission line diagnostics.
From this sample of 84 GRBHs (at the time of proposal writing), we selected those which either have a measured (extinction-corrected) UV/optical-SFR >15 M⊙/yr or a high stellar mass of log(M/M⊙) > 10.5 and are at sufficiently small redshifts to ensure flux detection. Nondetections were ignored in this selection, but mass measurements from different methods were allowed. The mass cut implies that using the mean specific SFR of GRBHs of 0.4 Gyr-1 at z ≈ 1, the total SFR should be above 15 M⊙/yr. This results in a total of 11 targets, at redshifts 0.5 < z < 2.6. We observed 6 of these targets with ATCA and another 5 sources with the VLA, with details given in Table 1.
GRB 050219 was not among the originally proposed targets (neither the SFR nor mass was known at the time of observation), but was observed as an ATCA filler target in otherwise not usable gaps. It is thus listed separately at the end of Table 1, which lists the details of all our 12 observed sources.
2.1. ATCA
We have chosen to observe with ATCA at 2.1 GHz since the sensitivity is 20% to 70% better than the frequently used 5.5/9 GHz frequencies (see the 2012 version of the CABB sensitivity calculator), and the negative spectral slope results in brighter emission. With this choice, we accept the fact that the synthesized beam is a factor 3−5 worse, but we note that most of the GRB hosts of our sample have an extent smaller than about 1 arcsec; the exceptions are GRBs 020819B, 050219, 080319C, and 110918A (see below).
With ATCA, we observed our sample sources (project C2718; PI: J. Greiner) with the CFB 1M-0.5K mode in the 6 km configuration, providing 2048 channels per 2048 MHz continuum IF (1 MHz resolution) and 2048 channels per 1 MHz zoom band (0.5 kHz resolution). Most sources were observed over the full range of hour angles to ensure good uv-plane coverage.
Data analysis was performed using the standard software package MIRIAD (Sault et al. 1995), applying appropriate bandpass, phase, and flux calibrations. Substantial flagging had to be applied to remove radio frequency interference (RFI), removing up to 30% of the original data. Multifrequency synthesis images were constructed using robust weighting (robust = 0) and the full bandwidth between its flagged edges. The noise was determined by estimating the rms in emission-free parts of the cleaned map (using kvis).
GRB host flux density measurements.
2.2. VLA
We observed five sources at S band in B configuration (project 13B-017; PI: J. Greiner). The observations were performed in full polarization mode, with a total synthesized bandwidth of 2 GHz, centered at 3.0 GHz. We used standard amplitude and bandwidth calibration (observing 3C48, 3C147, or 3C295, depending on the source), and a bright nearby phase calibrator for each of the targets (see Table 1). We reduced the data using the Common Astronomy Software Applications package (CASA; McMullin et al. 2007). The noise was determined as the rms in emission-free regions in the images.
The data reduction was problematic for four reasons: (i) the phase calibrators used were not optimal for S band in the observed configuration, with resolved structure and important closure errors; (ii) the strong radio frequency interference (RFI) was the main culprit for data flagging (see Table 2), except for GRB 080605 (see below); (iii) the presence of strong sources in the field that limited the dynamic range of the synthesized images (last column in Table 2); and (iv) significant gain variation due to variable power from geostationary satellites entering the analog signal path through the sidelobes of the antennas; this affects sources in the declination range from −14.̊5 < Dec < +5.̊5 (e.g., Perley et al. 2015), thus necessitating >60% data flagging for GRB 080605.
3. Results
3.1. Radio flux measurements
We detect only one of our targets, the nearest one, namely GRB 020819B with a measured flux F(3 GHz) = 31 ± 8 μJy. The peak of the radio emission is at RA (2000.0) = 23:27:19.50, Dec (2000) = +06:15:55.8 with an error of 0.̋3. This is 0.̋37 away from the center of the radio afterglow position (which itself has a 0.̋5 error), which is significantly smaller than the beam size. Given the beam size of ≈2′′, the radio emission is clearly associated with the GRB position.
For all our other targets, we are only able to establish upper limits, in the range of 10−60 μJy (2σ; Table 2).
Unfortunately, in many cases we did not reach our design sensitivity (see Table 2), namely 3−5 μJy, which would have guaranteed that we are sensitive to SFRRadio equal to the measured UV/optical SFR. Yet, the many nondetections imply that SFRRadio is not substantially higher than the UV/optical SFR.
Physical parameters of GRB host galaxies: the first block is our observed sample; the second block is taken from the literature (upper limits are only included if they are not more than a factor 100 above SFRopt.
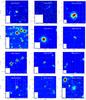 |
Fig. 1 Radio contours (at 2×, 3×, 4×, and 5× the rms in each image) overplotted over the optical host images. The red circle is the GRB afterglow position with its uncertainty (see Table 3). The optical images are taken with VLT/FORS2/R (GRBs 000210, 050219, 090926B), VLT/ISAAC/J (GRB 030528), Gemini-N/MOS/R (GRB 020819B), HST/STIS (GRB 020127), HST/WFC3/F160W (GRBs 080319C, 080605, 081109, 090113, 100621A), and 2.2 m/GROND/r′ (GRB 110918A). |
3.2. Radio-derived SFRs
A number of relations between star formation and corresponding radio fluxes have been proposed, for example (Yun & Carilli 2002; Bell 2003; Murphy et al. 2011), resulting in differences of order a factor of 2. At our observed radio frequencies, free-free emission is negligible, so we choose to use Eq. (17) of Murphy et al. (2011). We extrapolate fluxes from the rest-frame frequency to 1.4 GHz (as used in that equation) with a power law of slope Fν ∝ να including proper k correction. This leads to a relation for the radio-derived star formation rate SFRRadio as follows: 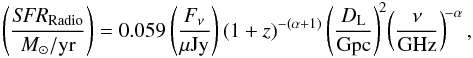 where Fν and ν are the observer frame radio flux and frequency, z is the redshift of the GRB, and α is the spectral slope of the radio continuum emission. Following Yun & Carilli (2002), Murphy et al. (2011), and Perley & Perley (2013), we assume α = −0.75 throughout. For the estimate of the luminosity distance DL, we use the cosmological parameters from the latest Planck Collaboration XIII (2016), i.e., H0 = 67.8 km s-1/Mpc, Ωm = 0.308 and ΩΛ = 0.692. The results are given in the last column of Table 3. We also include in Table 3 those GRB hosts previously detected in the radio band and, for consistency, use the above equation and parameters to recompute SFRRadio.
There are some discrepancies of our SFRRadio values when compared to literature values.
-
Our SFRRadio values are about 20% lower than those in Perley & Perley (2013), owing to the different normalization factors (0.072 vs. 0.059); this is possibly because of some confusion in their Eq. (2) of the sign of the spectral continuum slope, which makes the extrapolation to 1.4 GHz wrong. In their Eq. (2) the exponent of the (1 + z) dependence and the sign of the exponent in the luminosity distance dependence are wrong, but the SFRRadio values in their Table 4 are computed with the correct dependencies (apart from the above normalization factor). In contrast, we reproduce the SFRRadio values of Perley et al. (2015) to within <2%, which is likely due to the different (but not specified) cosmological parameters.
-
The SFRRadio values of Berger et al. (2003) are reproduced within a factor of <2 (with their cosmological parameters and their usage of a spectral slope of −0.6 following Fomalont et al. 2002). However, it is not clear how their single SFRRadio is derived from radio measurements at three different frequencies: each of these measurements would give a separate SFRRadio, and the corresponding spread also amounts to a factor of two. Thus, we consider this as (broadly) consistent, but their Eq. (1) also has the sign of the spectral slope confused, and the luminosity distance is in units of Gpc rather than Mpc.
-
Stanway et al. (2014) use the same conversion prescription as Berger et al. (2003) and Yun & Carilli (2002), and so a similar comment on the spectral slope sign applies. Stanway et al. (2014) specify the cosmological parameters used, and so we can exactly reproduce their SFRRadio limits for the last four entries of their Table 1 if we use twice their flux error as upper limit. However, for all the other nondetected hosts we fail to reproduce their numbers with that same approach; instead, we find larger limits in proportion of the flux limits. In comparison to the conversion prescription of Murphy et al. (2011) used here, all SFRRadio limits derived with twice their flux error are about a factor 2−3 higher. This is a combination of both the different normalization factor and the steeper slope in extrapolating to 1.4 GHz.
-
We can reproduce the SFRRadio values in Hatsukade et al. (2012) except for a factor of exactly 2.0, suggesting that their upper limits are at the 1σ confidence level, rather than at 2σ as stated.
-
We can exactly reproduce the SFRRadio values in Michałowski et al. (2012) when accounting for the different normalizations (5.52 in Bell 2003 vs. 6.35 in Murphy et al. 2011) and cosmological parameters used. For consistency, we recompute their values, and also adopt 2σ limits instead of their 3σ limits.
For consistency in the interpretation below, we recompute all SFRRadio values from the literature, based on the reported radio fluxes and frequencies. For the upper limits, we assume that errors are given at 1σ, and so we take twice the error as the rms if it is not otherwise given; thus, all upper limits reported below are at the 2σ confidence level.
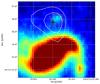 |
Fig. 2 Zoom-in on the image of GRB 020819B (taken from Graham et al. (2016)), showing the optical emission at the GRB position more clearly (red circle), where we now detect radio flux (centered on the black cross). The offset to the center of the host galaxy is 3′′. The nondetection of the host galaxy at 3 GHz is surprising. |
4. Interpretation and discussion
Our prime result is the detection of radio emission at the afterglow position of GRB 020819B. In addition, we also discuss the upper limits of two other specific GRBs before summarizing the sample result and its implications.
4.1. GRB 020819B
The only clearly detected source in our sample is GRB 020819B at z = 0.41. The star formation rate implied by our radio detection is SFRRadio = 20.2 ± 5.2 M⊙/yr. This is consistent with the 2σ upper limit from Stanway et al. (2010) of <22.6 M⊙/yr, which is recomputed as described above. Accounting for the error in our measurement, our SFRRadio is only 50% larger than the Hα-based SFRHα = 10.2 M⊙/yr from Levesque et al. (2010) (no error given).
However, it is surprising that no radio emission is detected from the nucleus of the host galaxy itself (Fig. 2). With its SFRHα = 23.6 M⊙/yr, which is two times larger than at the afterglow position, and similar extinction values for both locations (Levesque et al. 2010), one would expect a flux of ≈60 μJy. Performing aperture photometry on the Jy/pixel map, we measure the total emission encompassing the host galaxy and afterglow position as 46 μJy, which results in an integrated flux from the host galaxy of 15 ± 8 μJy. This implies a 2σ upper limit of SFRRadio< 10M⊙/yr for the entire host, to be compared with a host SFRHα = 23.6 M⊙/yr (Levesque et al. 2010, no error given except a note of a ±5% flux error, which would transform into a SFR error of about ±1 M⊙/yr). The substantially different radio fluxes at the GRB versus host center, despite similar optical SFR, raises doubts about the association of the detected radio emission at the afterglow position with star formation. Thus, this raises doubts about the question of possible afterglow contamination of our measurement.
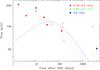 |
Fig. 3 Radio afterglow light curve of GRB 020819B with the early data (<160 days) from Jakobsson et al. (2005), the ATCA upper limits at 2700 days from Stanway et al. (2010), and our VLA measurement (blue hexagon). The red dotted curve is the best-fit model from Jakobsson et al. (2005) to the early-time light curve (the very early data points until 10 days post-burst are explained as scintillation). The green dashed and blue solid curves are the same model, but for the correspondingly lower frequencies, which are shifted in peak time and peak flux according to the standard synchrotron fireball model Granot & Sari (2002). |
Given that our radio observation was more than 10 yr after the GRB, and the radio afterglow had already declined to <35 μJy at 8.46 GHz within 150 days after the GRB (Frail & Berger 2003), one could dismiss this option. However, looking more closely at the full radio light curve, which is compiled from data from Jakobsson et al. (2005) and Stanway et al. (2010) and includes our measurement (Fig. 3), the situation is less obvious. The best-fit model of the early-time radio data with a decay slope of t-0.78 (Jakobsson et al. 2005) is shown as well; it is compatible with the theoretically expected decay in an ISM-like environment for an electron index p = 2. Adopting the same model, but plotting the corresponding light curve at 3 GHz (blue curve in Fig. 3), our measurement is only 3σ above the afterglow extrapolation. There are two reasons why the model light curve is an underprediction for late times: firstly, once the blast wave transitions to the nonrelativistic case, the light curve is expected to flatten. Secondly, once the emission is not beamed anymore, also the counterjet will become visible, leading to a doubling of the flux. Also, given some uncertainties in the model fitting due to sparse early radio data and the effect of scintillation, it seems possible to associate our observed flux with either pure afterglow flux or a combination of star formation and afterglow contamination. The latter interpretation is also consistent with the 5.5 GHz limit obtained in Jan. 2010 (Stanway et al. 2010), which otherwise would imply an only marginally consistent spectral slope for an afterglow spectrum. We therefore adopt an upper limit on the radio-derived SFR at the GRB explosion site of SFRRadio< 20M⊙/yr as listed in Table 3, and note that the limit would drop to SFRRadio< 10M⊙/yr if we assigned the observed flux equally to afterglow and star formation origin.
We note in passing that the 1.2 mm ALMA detection (140 ± 30 μJy) at the position of the afterglow reported by Hatsukade et al. (2014) is by far too bright to be consistent with an afterglow interpretation, although the nondetection of the host galaxy at 1.2 mm is similarly surprising. With the ALMA and our VLA observations only 12 months apart, which implies a <10% change in afterglow flux, we predict a 1.2 mm GRB afterglow flux at the time of the ALMA observation of 3 μJy. Conversely, assuming that the ALMA 1.2 mm detection of the GRB site is powered by star formation allows us to roughly predict the radio flux. Unfortunately, because of widely different SED shapes the expected flux varies from > 100 μJy (models corresponding to M 82 and the WR region in Michałowski et al. 2014) to 3 uJy (spiral Sc); see extended data Fig. 1 in Hatsukade et al. (2014) for illustration. Hence, the ALMA detection is consistent with 10−100% of our 5 GHz flux being powered by star formation.
4.2. GRB 000210
Berger et al. (2003) reported a 2σ detection of 18 ± 9 μJy in the host galaxy at 8.46 GHz with the VLA, corresponding to SFRRadio = 138 ± 69 M⊙/yr (re-computed). Our 2σ upper limit at 2.1 GHz of <32 μJy, corresponding to a SFRRadio< 80M⊙/yr does not provide any further support in favor or against this low-significance result.
4.3. GRB 100621A
The ATCA radio fluxes of F(5.5 GHz) = 120 ± 32 μJy and F(9.0 GHz) = 106 ± 42 μJy measured during 15−19 April 2011 (Stanway et al. 2014) are consistent within the errors with the flux measured within a week after the GRB that had been associated with the radio afterglow (Greiner et al. 2013). Based on this coincidence, Stanway et al. (2014) suggested that this early radio emission was not due to the afterglow, but instead due to the host galaxy. Our upper limit at 2.1 GHz makes this interpretation very unlikely, unless the spectrum has a very unusual shape. This in turn implies that the flux measured in April 2011 was still the afterglow, which is not uncommon for LGRBs one year after the burst. Similar 5 GHz afterglow fluxes at 1 week and 1 yr after the burst were also obtained for GRB 030329 (van der Horst et al. 2005, their Fig. 1), and are standard for those afterglows which are either particularly energetic, or expand into a high-density medium (Chandra & Frail 2012, their Fig. 23).
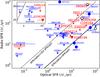 |
Fig. 4 Star formation rates for GRB hosts measured in the radio band vs. those measured in the optical. Red symbols are from our observations, blue from the literature, where SFRopt = SFRHα whenever available, and SFRopt = SFRUV for the rest (open circles) (see Table 3 for details). |
4.4. Little dust-obscured star formation
Our resulting upper limits for the radio-based star formation rate for GRBs 020819B, 030528, 110918A, and 100621A already suggest that the obscured star formation in GRB hosts is at most a factor 2−3 larger than the SFR derived from optical measurements. The increasing collection of upper limits at low flux levels, in particular the many from Perley et al. (2015), provide mounting evidence for only a small amount, if any, of dust-obscured star formation in GRB host galaxies in this redshift range. Figure 4 shows a compilation (based on Table 3) of the ratio of optical versus radio-derived star formation rates. Apart from the five detections at SFRRadio/SFRopt ≈ 1, there are more than a dozen upper limits suggesting SFRRadio/SFRopt< 3. This may be be explained if GRB hosts are at the beginning of a star formation episode (Michałowski et al. 2015), so the radio emission has not had time to build up yet, unlike Hα emission.
There have been early suggestions that GRB host galaxies show high specific star formation rates (sSFR), e.g., Castro Ceron et al. (2006), Savaglio et al. (2009), Castro Ceron et al. (2010). A recent compilation of GRB host galaxies with known mass and (optically determined) star formation rates (Savaglio 2015) is shown in Fig. 5, showing that most hosts have a specific SFR larger than 0.4 Gyr. Our sample selection was based on the idea that selecting high sSFR objects at low redshifts could enhance the detection fraction of GRB hosts in the radio band. Our low detection rate is a result of the sSFR varying substantially from host to host, and the lack of any substantial obscured star formation even in the most massive GRB hosts.
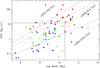 |
Fig. 5 Star formation rate vs. stellar mass for GRB hosts from Savaglio (2015), plotted in four redshift intervals: z< 0.5 (blue), 0.5 <z< 1 (green), 1 <z< 2 (red), and z> 2 (black). Red open triangles show those with previously reported radio detections. Open red diamonds denote our sample with the red asterisk being GRB 050219, not belonging to the original sample selection. The colored lines are the main-sequence relations for each of the four redshift bins (Speagle et al. 2014). The diagonal dashed line indicates the specific SFR = 0.4/Gyr. While high specific SFR (outside the dashed box; the three GRBs at ≈ 0.2M⊙/yr were reported only after we made our selection and executed the observations) suggested to be a promising selection criterion for a large radio detection probability, this is not borne out by our observations. |
5. Conclusions
We have observed a subpopulation of massive GRB hosts that had not yet been observed previously in radio wavelengths. Our observations do not add any GRB host to the known sample of radio-detected hosts. Our selection was independent of the amount of dust found in these galaxies (corresponding to a Spitzer or Herschel detection). Instead, it was intentionally biased toward hosts with either large optical star formation rates or high masses. While there is some room for improvements of our limits with existing telescopes, the majority of GRB hosts are below the few μJy rms limit of ATCA and VLA.
Earlier papers have reported radio-derived SFRs typically at least a factor 10 higher than (dust-corrected) optically derived SFRs, therefore concluding that the majority of star formation in GRB hosts is obscured by dust. Combining the more recent measurements in the literature with those presented here, our larger sample does not show strong evidence in favor of such an interpretation. Instead, the radio-based star formation rates, including the best upper limits, are in general not substantially higher than those obtained with optical/UV measurements, and thus the dust-obscured star formation in GRB hosts at low redshifts (our largest redshift is 1.9) is negligible.
Our nondetections include GRB 100621A for which Stanway et al. (2014) had claimed a host detection; our upper limit implies that their radio detection was due to afterglow emission.
We detect GRB 020819B at 4σ at 3 GHz, at about 11 yr after the burst. We argue that a good fraction of this emission, if not all, is due to afterglow emission, thus adding GRB 020819B to the group of GRBs with very long-lasting detected radio afterglows, where GRB 030329 is the most prominent example (van der Horst et al. 2008). In a similar case, GRB 980425, with a radio-bright knot at the GRB position, an afterglow interpretation has been excluded (Michałowski et al. 2014).
Acknowledgments
We thank the anonymous referee for constructive comments. J.G. and S.K. express particular thanks to K. Bannister, R. Wark, and J. Collier for support during the ATCA observations. J.G. acknowledges support by the DFG cluster of excellence “Origin and Structure of the Universe” (www.universe-cluster.de), and M.J.M. the support of the UK Science and Technology Facilities Council. R.H.I. acknowledges support from the Spanish MINECO through grants AYA2012-38491-C02-02 and AYA2015-63939-C2-1-P, partially funded by FEDER funds. P.S., J.F.G., and T.K. acknowledge support through the Sofja Kovalevskaja award to P. Schady from the Alexander von Humboldt Foundation Germany. S.K. acknowledges support by DFG grant Kl 766/16-1. The Australia Telescope Compact Array is part of the Australia Telescope National Facility, which is funded by the Commonwealth of Australia for operation as a National Facility managed by CSIRO. The National Radio Astronomy Observatory is a facility of the National Science Foundation operated under cooperative agreement by Associated Universities, Inc. This research has made use of the GHostS database (www.grbhosts.org), which is partly funded by Spitzer/NASA grant RSA Agreement No. 1287913.
References
- Atteia, J.-L., Kawai, N., Lamb, D., et al. 2003, GCN, #2256 [Google Scholar]
- Baumgartner, W. H., Barthelmy, S. D., Cummings, J. R., et al. 2009, GCN, #9939 [Google Scholar]
- Bell, E. F. 2003, ApJ, 586, 794 [Google Scholar]
- Berger, E., Kulkarni, S. R., & Frail, D. A. 2001, ApJ, 560, 652 [NASA ADS] [CrossRef] [Google Scholar]
- Berger, E., Cowie, L. L., Kulkarni, S. R., et al. 2003, ApJ, 588, 99 [NASA ADS] [CrossRef] [Google Scholar]
- Berger, E., Fox, D. B., Kulkarni, S. R., Frail, D. A., & Djorgovski, S. G. 2007, ApJ, 660, 504 [NASA ADS] [CrossRef] [Google Scholar]
- Briggs, M. S. 2009, GCN, #9957 [Google Scholar]
- Butler, N. R., Dullighan, A., Ford, P., et al. 2003, GCN, #2279 [Google Scholar]
- Butler, N. R., Bloom, J. S., Poznanski, D., et al. 2010, ApJ, 711, 495 [NASA ADS] [CrossRef] [Google Scholar]
- Cano, Z., Bersier, D., Guidorzi, C., et al. 2011, MNRAS, 413, 669 [NASA ADS] [CrossRef] [Google Scholar]
- Castro Ceron, J. M., Michałowski, M. J., Hjorth, J., et al. 2006, ApJ, 653, L85 [NASA ADS] [CrossRef] [Google Scholar]
- CastroCeron, J. M., Michałowski, M. J., Hjorth, J., et al. 2010, ApJ, 721, 1919 [NASA ADS] [CrossRef] [Google Scholar]
- Chandra, P., & Frail, D. A. 2012, ApJ, 746, 156 [NASA ADS] [CrossRef] [Google Scholar]
- Cenko, S. B., Tanvir, N. R., Ofek, E. O., et al. 2011, GCN, #12367 [Google Scholar]
- Clemens, C., Krühler, T., & Greiner, J. 2008, GCN, #8515 [Google Scholar]
- Condon, J. J. 1992, ARA&A, 30, 575 [NASA ADS] [CrossRef] [MathSciNet] [Google Scholar]
- Cummings, J., Barthelmy, S. D., Baumgartner, W., et al. 2008, GCN, #7839 [Google Scholar]
- D’Avanzo, P., Covino, S., Antonelli, L. A., et al. 2008, GCN, #8501 [Google Scholar]
- Elliott, J., Krühler, T., Klose, S., et al. 2011, GCN, #12366 [Google Scholar]
- Elliott, J., Greiner, J., Khochfar, S., et al. 2012, A&A, 539, A113 [NASA ADS] [CrossRef] [EDP Sciences] [Google Scholar]
- Elliott, J., Krühler, T., Greiner, J., et al. 2013, A&A, 556, A23 [NASA ADS] [CrossRef] [EDP Sciences] [Google Scholar]
- Fomalont, E. B., Kellermann, K. I., Partridge, R. B., Windhorst, R. A., & Richards, E. A. 2002, AJ, 123, 2402 [NASA ADS] [CrossRef] [Google Scholar]
- Fox, D. W. 2002, GCN, #1249 [Google Scholar]
- Fox, D. W., & Frail, D. A. 2002, GCN, #1250 [Google Scholar]
- Fox, D. W., Djorgovski, S. G., & Kulkarni, S. R. 2002, GCN, #1306 [Google Scholar]
- Frail, D. A., & Berger, E. 2003, GCN, #1842 [Google Scholar]
- Frederiks, D. D., Hurley, K., Svinkin, D. S., et al. 2013, ApJ, 779, 151 [Google Scholar]
- Fynbo, J. P. U., Malesani, D., Jakobsson, P., & D’Elia, V. 2009, GCN, #9947 [Google Scholar]
- Garcia, M., Piro, L., Garmire, G., & Nichols, J. 2000, GCN, #544 [Google Scholar]
- Golenetskii, S., Aptekar, R., Mazets, E., et al. 2008, GCN, #7487 [Google Scholar]
- Golenetskii, S., Aptekar, R., Frederiks, D. D., et al. 2011, GCN, #12362 [Google Scholar]
- Gorosabel, J., Jensen, B. L., Olsen, L. F., et al. 2000, GCN, #545 [Google Scholar]
- Gorosabel, J., Christensen, L., Hjorth, J., et al. 2003, A&A, 400, 127 [NASA ADS] [CrossRef] [EDP Sciences] [Google Scholar]
- Graham, J. F., & Fruchter, A. S. 2016, ApJ, submitted [arXiv:1511.01079] [Google Scholar]
- Graham, J. F., Fruchter, A. S., Levesque, E. M., et al. 2016, ApJ, submitted [arXiv:1511.00667] [Google Scholar]
- Granot, J., & Sari, R. 2002, ApJ, 568, 820 [NASA ADS] [CrossRef] [Google Scholar]
- Greiner, J., Rau, A., & Klose, S. 2003, GCN, #2271 [Google Scholar]
- Greiner, J., Krühler, T., Nardini, M., et al. 2013, A&A, 560, A70 [NASA ADS] [CrossRef] [EDP Sciences] [Google Scholar]
- Greiner, J., Fox, D. B., Schady, P., et al. 2015, ApJ, 809, 76 [NASA ADS] [CrossRef] [Google Scholar]
- Hatsukade, B., Hashimoto, T., Ohta, K., et al. 2012, ApJ, 748, 108 [NASA ADS] [CrossRef] [Google Scholar]
- Hatsukade, B., Ohta, K., Endo, A., et al. 2014, Nature, 510, 247 [NASA ADS] [CrossRef] [Google Scholar]
- Hjorth, J., Sollerman, J., Møller, P., et al. 2003, Nature, 423, 847 [NASA ADS] [CrossRef] [PubMed] [Google Scholar]
- Hjorth, J., Malesani, D., Jakobsson, P., et al. 2012, ApJ, 756, 187 [NASA ADS] [CrossRef] [Google Scholar]
- Hullinger, D., Barthelmy, S. D., Barbier, L., et al. 2005, GCN, #3038 [Google Scholar]
- Hunt, L. K., Palazzi, E., Rossi, A., et al. 2011, ApJ, 736, L36 [NASA ADS] [CrossRef] [Google Scholar]
- Hunt, L. K., Palazzi, E., Michałowski, M. J., et al. 2014, A&A, 565, A112 [NASA ADS] [CrossRef] [EDP Sciences] [Google Scholar]
- Immler, S., Beardmore, A. P., Cummings, J. R., et al. 2008, GCN, #8500 [Google Scholar]
- Jakobsson, P., Frail, D. A., Fox, D. B., et al. 2005, ApJ, 629, 45 [NASA ADS] [CrossRef] [Google Scholar]
- Jakobsson, P., Vreeswijk, P. M., Xu, D., & Thöne, C. C. 2008, GCN, #7832 [Google Scholar]
- Japelj, J., Vergani, S. D., Salvaterra, R., et al. 2016, A&A, 590, A129 [NASA ADS] [CrossRef] [EDP Sciences] [Google Scholar]
- Kann, D. A., Laux, U., Klose, S., Ertel, S., & Greiner, J. 2008, GCN, #7829 [Google Scholar]
- Kennea, J. A., & Krimm, H. A. 2009, GCN, #8806 [Google Scholar]
- Kistler, M. D., Yüksel, H., Beacom, J. F., et al. 2009, ApJ, 705, L104 [NASA ADS] [CrossRef] [Google Scholar]
- Klose, S., Henden, A., Greiner, J., et al. 2002, GCN, #1520 [Google Scholar]
- Krimm, H. A., Barthelmy, S. D., Beardmore, A. P., et al. 2009, GCN, #8804 [Google Scholar]
- Krühler, T., Greiner, J., Schady, P., et al. 2011, A&A, 534, A108 [NASA ADS] [CrossRef] [EDP Sciences] [Google Scholar]
- Krühler, T., Fynbo, J. P. U., Geier, S., et al. 2012a, A&A, 546, A8 [NASA ADS] [CrossRef] [EDP Sciences] [Google Scholar]
- Krühler, T., Malesani, D., Milvang-Jensen, B., et al. 2012b, ApJ, 758, A46 [NASA ADS] [CrossRef] [Google Scholar]
- Krühler, T., Malesani, D., Fynbo, J. P. U., et al. 2015, A&A, 581, 125 [Google Scholar]
- Kuin, N. P. M., & Immler, S. 2008, GCN, #8523 [Google Scholar]
- Küpcü-Yoldas, A., Greiner, J., Klose, S., Krühler, T., & Savaglio, S. 2010, A&A, 515, L2 [NASA ADS] [CrossRef] [EDP Sciences] [Google Scholar]
- Le Floc’h, E., Duc, P.-A., Mirabel, I. F., et al. 2003, A&A, 400, 499 [NASA ADS] [CrossRef] [EDP Sciences] [Google Scholar]
- Levan, A. J., Tanvir, N. R., Wiersema, K., Berger, E., & Fox, D. 2011, GCN, #12368 [Google Scholar]
- Levesque, E. M., Kewley, L. J., Graham, J. F., & Fruchter, A. S. 2010, ApJ, 712, L26 [NASA ADS] [CrossRef] [Google Scholar]
- Mangano, V., Sbarufatti, B., Evans, P. A., & Krimm, H. A. 2011, GCN, #12364 [Google Scholar]
- Marisaldi, M., Fornari, F., Labanti, C., et al. 2008, GCN, #7457 [Google Scholar]
- McConnell, D., Subrahmanyan, R., Wieringa, M. H., et al. 2000, GCN, #560 [Google Scholar]
- McMullin, J. P., Waters, B., Schiebel, D., Young, W., & Golap, K. 2007, in Proc. Astronomical Data Analysis Software and Systems XVI, Oct. 15−18, 2006, Tucson (Arizona), eds. R. A. Shaw, F. Hill, & D. J. Bell., ASP Conf. Ser. 376, 127 [Google Scholar]
- Michałowski, M. J., Hjorth, J., Malesani, D., et al. 2009, ApJ, 693, 347 [NASA ADS] [CrossRef] [Google Scholar]
- Michałowski, M. J., Hjorth, J., Watson, D., et al. 2010, A&A, 514, A67 [NASA ADS] [CrossRef] [EDP Sciences] [Google Scholar]
- Michałowski, M. J., Kamble, A., Hjorth, J., et al. 2012, ApJ, 755, 85 [NASA ADS] [CrossRef] [Google Scholar]
- Michałowski, M. J., Hunt, L. K., Palazzi, E., et al. 2014, A&A, 562, A70 [NASA ADS] [CrossRef] [EDP Sciences] [Google Scholar]
- Michałowski, M. J., Gentile, G., Hjorth, J., et al. 2015, A&A, 582, 78 [Google Scholar]
- Milvang-Jensen, B., Goldoni, P., Tanvir, N. R., et al. 2010, GCN, #10876 [Google Scholar]
- Moin, A., Tingay, S., Phillips, C., et al. 2008, GCN, #8636 [Google Scholar]
- Morii, N., Nakajima, M., Matsuoka, M., et al. 2009, GCN, #9943 [Google Scholar]
- Murphy, E. J., Condon, J. J., Schinnerer, E., et al. 2011, ApJ, 737, 67 [NASA ADS] [CrossRef] [Google Scholar]
- Olivares Estay, F., Rossi, A., Greiner, J., Yoldas, A., & Küpcü Yoldas, A. 2009, GCN, #8812 [Google Scholar]
- Pagani, C., Barthelmy, S. D., Baumgartner, W. H., et al. 2008, GCN, #7442 [Google Scholar]
- Perley, D. A. 2012, in Gamma-Ray Bursts 2012, Proc. of Conf., PoS(GRB 2012) [Google Scholar]
- Perley, D. A., & Perley, R. A. 2013, ApJ, 778, 172 [NASA ADS] [CrossRef] [Google Scholar]
- Perley, D. A., Cenko, S. B., Bloom, J. S., et al. 2009, AJ, 138, 1690 [NASA ADS] [CrossRef] [Google Scholar]
- Perley, D. A., Levan, A. J., Tanvir, N. R., et al. 2013, ApJ, 778, 128 [NASA ADS] [CrossRef] [Google Scholar]
- Perley, D. A., Perley, R. A., Hjorth, J., et al. 2015, ApJ, 801, 102 [NASA ADS] [CrossRef] [Google Scholar]
- Perley, D. A., Tanvir, N. R., Hjorth, J., et al. 2016, ApJ, 817, 8 [NASA ADS] [CrossRef] [Google Scholar]
- Piro, L., Frail, D. A., Gorosabel, J., et al. 2002, ApJ, 577, 680 [NASA ADS] [CrossRef] [Google Scholar]
- Planck Collaboration XIII. 2016, A&A, in press, DOI: 10.1051/0004-6361/201525830 [Google Scholar]
- Rau, A., Salvato, M., & Greiner, J. 2005, A&A, 444, 425 [NASA ADS] [CrossRef] [EDP Sciences] [Google Scholar]
- Ricker, G., Atteia, J.-L., Kawai, N., et al. 2002, GCN, #1229 [Google Scholar]
- Robertson, B. E., & Ellis, R. S. 2012, ApJ, 744, 95 [NASA ADS] [CrossRef] [Google Scholar]
- Rossi, A., Klose, S., Ferrero, P., et al. 2012, A&A, 545, A77 [NASA ADS] [CrossRef] [EDP Sciences] [Google Scholar]
- Rossi, A., Piranomonte, S., Savaglio, S., et al. 2014, A&A, 572, A47 [NASA ADS] [CrossRef] [EDP Sciences] [Google Scholar]
- Sault, R. J., Teuben, P. J., & Wright, M. C. H. 1995, in Astronomical Data Analysis Software and Systems IV, eds. R. Shaw et al., ASP Conf. Ser., 77, 433 [NASA ADS] [Google Scholar]
- Savaglio, S. 2015, GHostS database, http://www.grbhosts.org, accessed Nov. [Google Scholar]
- Savaglio, S., Glazebrook, K., & Le Borgne, D. 2009, ApJ, 691, 182 [NASA ADS] [CrossRef] [MathSciNet] [Google Scholar]
- Savaglio, S., Rau, A., Greiner, J., et al. 2012, MNRAS, 420, 627 [NASA ADS] [CrossRef] [Google Scholar]
- Sbarufatti, B., Barthelmy, S. D., Burrows, D. N., et al. 2008, GCN, #7828 [Google Scholar]
- Soderberg, A. M., Nakar, E., Cenko, S. B., et al. 2007, ApJ, 661, 982 [NASA ADS] [CrossRef] [Google Scholar]
- Speagle, J. S., Steinhardt, C. L., Capak, P. L., & Silverman, J. D. 2014, ApJS, 214, 15 [NASA ADS] [CrossRef] [Google Scholar]
- Stanek, K. Z., Matheson, T., Garnavich, P. M., et al. 2003, ApJ, 591, L17 [NASA ADS] [CrossRef] [Google Scholar]
- Stanway, E. R., Davies, L. J. M., & Levan, A. J. 2010, MNRAS, 409, L74 [NASA ADS] [CrossRef] [Google Scholar]
- Stanway, E. R., Levan, A. J., & Davies, L. J. M. 2014, MNRAS, 444, 2133 [NASA ADS] [CrossRef] [Google Scholar]
- Stanway, E. R., Levan, A. J., Tanvir, N. R., et al. 2015, MNRAS, 446, 3911 [NASA ADS] [CrossRef] [Google Scholar]
- Stornelli, M., Celidonio, G., Muller, J. M., et al. 2000, GCN, #540 [Google Scholar]
- Svensson, K. M., Levan, A. J., Tanvir, N. R., Fruchter, A. S., & Strolger, L.-G. 2010, MNRAS, 405, 57 [NASA ADS] [Google Scholar]
- Svensson, K. M., Levan, A. J., Tanvir, N. R., et al. 2012, MNRAS, 421, 25 [NASA ADS] [Google Scholar]
- Tanvir, N. R., Wiersema, K., Levan, A. J., et al. 2011, GCN, #12365 [Google Scholar]
- de Ugarte Postigo, A., Gorosabel, J., Castro-Tirado, A. J., & Thöne, C. C. 2011, GCN, #12375 [Google Scholar]
- Ukwatta, T. N., Barthelmy, S. D., Baumgartner, W. H., et al. 2010, GCN, #10870 [Google Scholar]
- Updike, A., Nicuesa Guelbenzu, A., Nardini, M., Krühler, T., & Greiner, J. 2010, GCN, #10874 [Google Scholar]
- van der Horst, A., Rol, E., Wijers, R. A. M. J., et al. 2005, ApJ, 634, 1166 [NASA ADS] [CrossRef] [Google Scholar]
- van der Horst, A., Kamble, A., Resmi, L., et al. 2008, A&A, 480, 35 [NASA ADS] [CrossRef] [EDP Sciences] [Google Scholar]
- Vanderspek, R., Villasenor, J., Jernigan, J. G., et al. 2002, GCN, #1508 [Google Scholar]
- Vergani, S. D., Salvaterra, R., Japelj, J., et al. 2015, A&A, 581, A102 [NASA ADS] [CrossRef] [EDP Sciences] [Google Scholar]
- Wiersema, K., Tanvir, N., Vreeswijk, P., et al. 2008, GCN, #7517 [Google Scholar]
- Yüksel, H., Kistler, M. D., Beacom, J. F., & Hopkins, A. M. 2008, ApJ, 683, L5 [NASA ADS] [CrossRef] [Google Scholar]
- Yun, M. S., & Carilli, C. L. 2002, ApJ, 568, 88 [NASA ADS] [CrossRef] [Google Scholar]
Appendix A: Notes on individual targets
GRB 000210 was a BSAX-detected burst with a duration of about 20 s (Stornelli et al. 2000), with its X-ray and optical afterglow rapidly identified (Garcia et al. 2000; Gorosabel et al. 2000). Radio observations revealed a source with 99 ± 21 μJy one week after the GRB, with 2σ upper limits before and after this detection down to 55 μJy and 32 μJy, respectively (McConnell et al. 2000; Piro et al. 2002). The host galaxy at a redshift of z = 0.8463 (Piro et al. 2002) with a mass of 9.31 ± 0.08 M⊙/yr Svensson et al. (2010) is marginally subluminous with MB = −20.18 mag with an SED-fitting based UV star formation rate of SFRUV = 2.1 ± 0.2 M⊙/yr (Gorosabel et al. 2003), which is consistent with ≈3 M⊙/yr as derived from the [OII] line (Piro et al. 2002). Berger et al. (2003) reports the detection of the host galaxy in the sub-mm and radio with a weighted flux of 2.97 ± 0.88 mJy at 350 GHz (based on three separate SCUBA observations with individual nondetections) and 18 ± 9 μJy at 8.46 GHz (VLA), implying a SFRsubmm = 560 ± 170 M⊙/yr.
GRB 020127 was a HETE II-detected burst with T90 ≈ 5 s (Ricker et al. 2002). Chandra follow-up observations revealed an X-ray counterpart (Fox 2002; Fox et al. 2002) and also a faint radio counterpart, but no optical afterglow, was identified (Fox & Frail 2002). The spectral energy distribution of the host galaxy is very red, leading to an extremely red object (ERO) classification. Using a dust-obscured star-forming galaxy template, Berger et al. (2007) derive the following parameters: a photometric redshift of 1.9 , an absolute rest-frame magnitude MAB(B) = −23.5 ± 0.1 mag, a stellar mass of the host in the range 1011−1012M⊙ (consistent with a more recent estimate of 1011.51M⊙ by Hunt et al. 2014), and an unobscured star formation rate of ≈6 M⊙/yr. Furthermore, a comparison to the mass-metallicity relation of UV-selected galaxies at similar redshift indicates that the host of GRB 020127 has a high metallicity in the range of about 0.5−1Z⊙ (Berger et al. 2007).
GRB 020819B was a HETE II-detected burst with T90 ≈ 20 s (Vanderspek et al. 2002); this burst is indeed GRB 020819B, although most papers in the literature designate this burst as GRB 020819. While even deep NIR imaging did not reveal an afterglow (Klose et al. 2002), VLA observations at 8.46 GHz revealed a radio afterglow, declining from about 380 μJy to <35 μJy over the course of 150 days (Frail & Berger 2003). The underlying host galaxy, a 8′′ diameter barred spiral, was identified by Jakobsson et al. (2005) at z = 0.41, with the GRB position about 3′′ off the galaxy core. The best-fit galaxy model implies a stellar mass of 1010.4M⊙, extinguished by AV = 2.2 ± 0.4 mag (Küpcü-Yoldas et al. 2010). The burst occurred in a high (about Z⊙) metallicity environment in which the host and burst site have similar metallicity (Levesque et al. 2010; Graham et al. 2016). An early attempt to detect the host galaxy with ATCA revealed 2σ upper limit on its 5.5 and 9.0 GHz flux of 22 and 92 μJy, respectively (Stanway et al. 2010), implying a limit on the radio-derived SFRRadio< 8M⊙/yr. Other SFR estimates were obtained by Savaglio et al. (2009) (SFRUV = 6.9M⊙/yr), Levesque et al. (2010) (SFRHα = 10.2M⊙/yr) and by Svensson et al. (2010) (SFRSED = 14.5M⊙/yr). Recently, ALMA detections of the CO(3−2) line and the 1.2 mm continuum at 1′′ angular resolution were also reported (Hatsukade et al. 2014). These detections showed the CO(3−2) emission centered on the nucleus of the host, while the 1.2 mm continuum is significantly detected only at the star-forming region ≈3′′ away from the nucleus, where the GRB occurred.
GRB 030528 was a HETE II-detected burst with T90 ≈ 40 s (Atteia et al. 2003) and a very low peak energy of the prompt emission, putting this burst in the category of X-ray flashes. A NIR (Greiner et al. 2003) and X-ray counterpart (Butler et al. 2003) were identified. Spectroscopy of the host galaxy allowed Rau et al. (2005) to determine the redshift, a stellar mass of 2 × 10¹⁰M⊙, a metallicity of 0.1−0.6Z⊙, and extinction-corrected star formation rates of SFRUV = 4−17M⊙/yr and SFROII = 6−37M⊙/yr, the relatively large range caused by applying different methods. Savaglio et al. (2009) estimate a stellar mass of 108.82 ± 0.39M⊙.
GRB 050219 was a Swift-detected burst with T90 = 23 s (Hullinger et al. 2005). No optical or radio afterglow was detected. Rossi et al. (2014) identify a 6′′ diameter early-type galaxy at the border of the 1.̋9 UVOT-enhanced X-ray error circle. A VLT/X-shooter spectrum reveals a redshift of z = 0.211, and a surprisingly low star formation rate of 0.06 M⊙/yr was derived based on the nonresolved [O II] doublet (Rossi et al. 2014). Based on the spectral energy distribution, Rossi et al. (2014) further derive a stellar mass of 109.98M⊙.
GRB 080319C was a Swift-, AGILE-, and Konus-detected burst with T90 = 20 s (Pagani et al. 2008; Marisaldi et al. 2008; Golenetskii et al. 2008) and a well-covered optical afterglow, the spectroscopy of which revealed a redshift of z = 1.95 (Wiersema et al. 2008). Keck imaging revealed a bright, blue 3′′ diameter galaxy interpreted as the host(Perley et al. 2009), although a relation to the z = 0.81 intervening absorber is not excluded. In the host interpretation, the stellar mass is an unparalleled log(M⋆/M⊙) = 12.22 ± 0.47 M⊙ (Savaglio 2015). Because of this high stellar mass we included this object in our sample, even though no star formation rate measurement has been reported yet. Recent evidence suggests that this large galaxy is a foreground object (Perley, priv. comm.), and thus the mass of the host of GRB 080319C remains unknown.
GRB 080605 was a bright Swift-detected burst with multiple peaks over a duration of about 80 s (Sbarufatti et al. 2008; Cummings et al. 2008), and a bright optical afterglow (e.g., Kann et al. 2008), allowing the detection of a wealth of absorption lines in a quick FORS spectrum revealing a redshift of z = 1.6398 (Jakobsson et al. 2008). The bright, blue host galaxy was discovered with late GROND imaging (Krühler et al. 2011), and studied in more detail by Krühler et al. (2012a), who find a stellar mass of 8 × 10⁹M⊙, a SFR
 M⊙/yr (as well as SFR
 M⊙/yr and SFR
 M⊙/yr), and a metallicity of 0.6 Z⊙. X-shooter spectroscopy resulted in SFR
 M⊙/yr Krühler et al. (2015), which is consistent with the earlier result.
GRB 081109 was a Swift- and Fermi/GBM-detected burst with a duration of 40 s (Immler et al. 2008) with a bright X-ray (Immler et al. 2008) and NIR counterpart (D’Avanzo et al. 2008), but only a faint optical counterpart, which is caused due to substantial extinction along the line of sight (Clemens et al. 2008). In the search for a radio afterglow, Moin et al. (2008) established a 2σ upper limit of <184 μJy/beam (4.9 GHz) at 15 days post-burst. The host galaxy is very bright and blue, thus even detected with Swift/UVOT (Kuin & Immler 2008), thus providing a well-covered spectral energy distribution; such a fit gives a stellar mass of log(M⋆/M⊙) = 9.8 ±0.09, modest host extinction of  = 1.0 ± 0.2 mag, and a SFR
 M⊙/yr (Krühler et al. 2011). Spectroscopy reveals the redshift (z = 0.9787) and a host-extinction-corrected SFR
 M⊙/yr (Krühler et al. 2011), while SFR
 M⊙/yr and a metallicity of 1.17 Z⊙ was derived from the X-shooter spectrum (Krühler et al. 2015).
GRB 090113 is a Swift- and Fermi/GBM-detected burst with a duration of 20 s (Krimm et al. 2009(@) with an X-ray (Kennea & Krimm 2009) but no optical counterpart (e.g., Olivares et al. 2009). The host galaxy is reported by Krühler et al. (2012b) based on the association with an unpublished NIR counterpart together with a redshift of z = 1.749 based on a X-shooter spectrum. Based on the Hα line flux, Krühler et al. (2015) derive a star formation rate of 18 M⊙/yr.
GRB 090926B was a Swift-, Fermi/GBM-, and MAXI-detected burst with T90 = 80−110 s (Baumgartner et al. 2009; Morii et al. 2009; Briggs 2009). No optical/radio afterglow was detected. A single galaxy was detected within the 1.̋4 UVOT-enhanced X-ray position uncertainty. Since it shows emission lines together with several absorption features at a common redshift of z = 1.24, this was interpreted as the host galaxy (Fynbo et al. 2009). The spectral energy distribution is well fit with an extinguished host model with = 1.4 mag, a stellar mass of log(M⋆/M⊙) = 10.1
 , and an extinction-corrected SFR
 M⊙/yr (Krühler et al. 2011). Based on the Hα line, Krühler et al. (2015) derive a star formation rate of 26
 M⊙/yr, and from the same X-shooter spectrum obtain and a metallicity of 0.45 Z⊙.
GRB 100621A was a Swift-detected burst with a duration of about 100 s with a bright X-ray afterglow (Ukwatta et al. 2010), but a highly dust-extinguished optical/NIR afterglow
(Updike et al. 2010; Greiner et al. 2013), suffering an extinction of AV = 3.8 mag (Krühler et al. 2011). At a redshift of z = 0.542 (Milvang-Jensen et al. 2010), the host is bright enough to be seen in the DSS2 (Updike et al. 2010) with an absolute magnitude of MB = −20.68 ± 0.08 mag, stellar mass of log(M⋆/M⊙) = 8.98 , and a host extinction-corrected (SED-derived) SFRUV = 13
 M⊙/yr (Krühler et al. 2011). Based on the Hα line in a X-shooter spectrum of the host, Krühler et al. (2015) derive SFRHα = 8.7 ± 0.8M⊙/yr. Vergani et al. (2015) estimate a metallicity of 0.4 Z⊙, while Krühler et al. (2015) derives 0.68 Z⊙. ATCA radio observations during 15−19 April 2011 at 5.5 and 9 GHz yield fluxes of F(5.5 GHz) = 120 ± 32 and F(9.0 GHz) = 106 ± 42 (Stanway et al. 2014).
GRB 110918A was one of the most intense IPN-triggered bursts ever, with a duration extending over at least 250 s (Golenetskii et al. 2011; Frederiks et al. 2013). Swift/XRT follow-up of the IPN error box identified the X-ray afterglow (Mangano et al. 2011) and subsequent optical observations identified a bright optical/NIR counterpart (Tanvir et al. 2011; Elliott et al. 2011; Cenko et al. 2011) spectroscopy, which revealed a redshift of z = 0.984 (Levan et al. 2011; Ugarte Postigo et al. 2011). The host galaxy is relatively large (half-light radius of 11 kpc) and massive log(M⋆/M⊙) = 10.68 ± 0.16, with a host-integrated metallicity around Z⊙, and a Hα-based star formation rate of SFRHα = 41 M⊙/yr (Elliott et al. 2013). Krühler et al. (2015) derive SFR
 M⊙/yr.
All Tables
Physical parameters of GRB host galaxies: the first block is our observed sample; the second block is taken from the literature (upper limits are only included if they are not more than a factor 100 above SFRopt.
All Figures
|
Fig. 1 Radio contours (at 2×, 3×, 4×, and 5× the rms in each image) overplotted over the optical host images. The red circle is the GRB afterglow position with its uncertainty (see Table 3). The optical images are taken with VLT/FORS2/R (GRBs 000210, 050219, 090926B), VLT/ISAAC/J (GRB 030528), Gemini-N/MOS/R (GRB 020819B), HST/STIS (GRB 020127), HST/WFC3/F160W (GRBs 080319C, 080605, 081109, 090113, 100621A), and 2.2 m/GROND/r′ (GRB 110918A). |
| In the text | |
|
Fig. 2 Zoom-in on the image of GRB 020819B (taken from Graham et al. (2016)), showing the optical emission at the GRB position more clearly (red circle), where we now detect radio flux (centered on the black cross). The offset to the center of the host galaxy is 3′′. The nondetection of the host galaxy at 3 GHz is surprising. |
| In the text | |
|
Fig. 3 Radio afterglow light curve of GRB 020819B with the early data (<160 days) from Jakobsson et al. (2005), the ATCA upper limits at 2700 days from Stanway et al. (2010), and our VLA measurement (blue hexagon). The red dotted curve is the best-fit model from Jakobsson et al. (2005) to the early-time light curve (the very early data points until 10 days post-burst are explained as scintillation). The green dashed and blue solid curves are the same model, but for the correspondingly lower frequencies, which are shifted in peak time and peak flux according to the standard synchrotron fireball model Granot & Sari (2002). |
| In the text | |
|
Fig. 4 Star formation rates for GRB hosts measured in the radio band vs. those measured in the optical. Red symbols are from our observations, blue from the literature, where SFRopt = SFRHα whenever available, and SFRopt = SFRUV for the rest (open circles) (see Table 3 for details). |
| In the text | |
|
Fig. 5 Star formation rate vs. stellar mass for GRB hosts from Savaglio (2015), plotted in four redshift intervals: z< 0.5 (blue), 0.5 <z< 1 (green), 1 <z< 2 (red), and z> 2 (black). Red open triangles show those with previously reported radio detections. Open red diamonds denote our sample with the red asterisk being GRB 050219, not belonging to the original sample selection. The colored lines are the main-sequence relations for each of the four redshift bins (Speagle et al. 2014). The diagonal dashed line indicates the specific SFR = 0.4/Gyr. While high specific SFR (outside the dashed box; the three GRBs at ≈ 0.2M⊙/yr were reported only after we made our selection and executed the observations) suggested to be a promising selection criterion for a large radio detection probability, this is not borne out by our observations. |
| In the text | |
Current usage metrics show cumulative count of Article Views (full-text article views including HTML views, PDF and ePub downloads, according to the available data) and Abstracts Views on Vision4Press platform.
Data correspond to usage on the plateform after 2015. The current usage metrics is available 48-96 hours after online publication and is updated daily on week days.
Initial download of the metrics may take a while.