Fig. 3
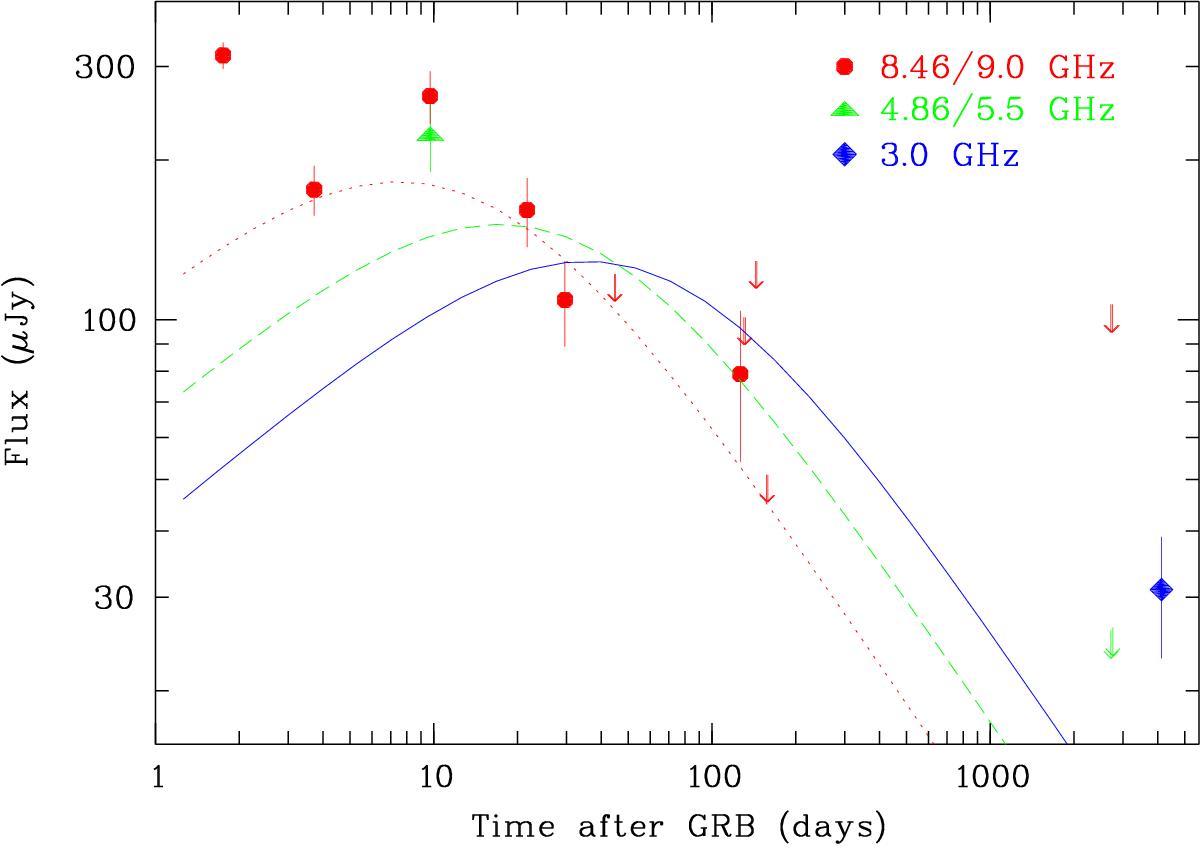
Radio afterglow light curve of GRB 020819B with the early data (<160 days) from Jakobsson et al. (2005), the ATCA upper limits at 2700 days from Stanway et al. (2010), and our VLA measurement (blue hexagon). The red dotted curve is the best-fit model from Jakobsson et al. (2005) to the early-time light curve (the very early data points until 10 days post-burst are explained as scintillation). The green dashed and blue solid curves are the same model, but for the correspondingly lower frequencies, which are shifted in peak time and peak flux according to the standard synchrotron fireball model Granot & Sari (2002).
Current usage metrics show cumulative count of Article Views (full-text article views including HTML views, PDF and ePub downloads, according to the available data) and Abstracts Views on Vision4Press platform.
Data correspond to usage on the plateform after 2015. The current usage metrics is available 48-96 hours after online publication and is updated daily on week days.
Initial download of the metrics may take a while.