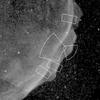
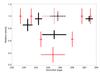
Fig. 4
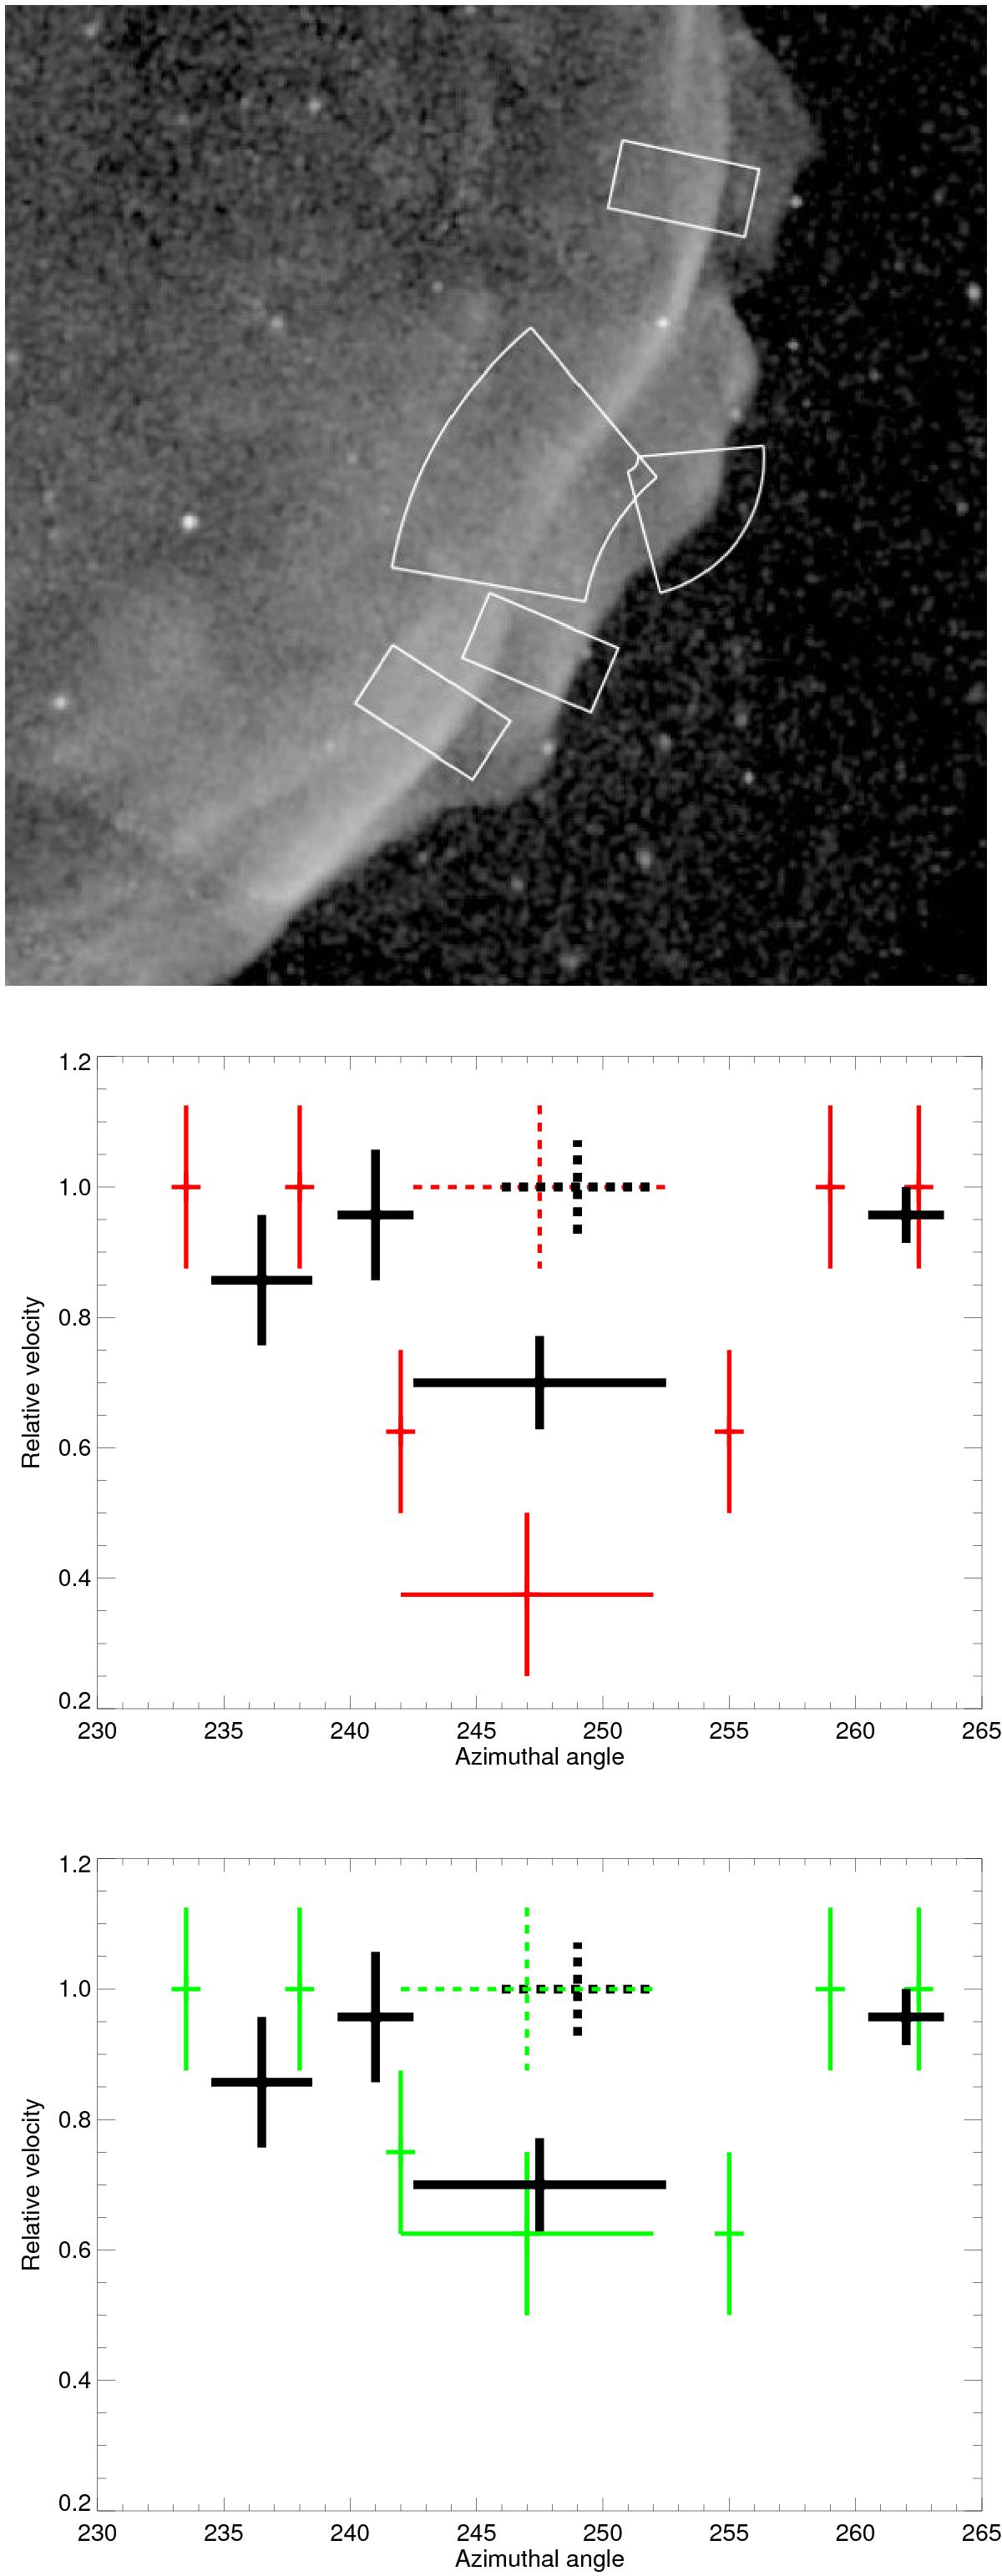
Upper panel: Chandra ACIS close-up view of the SN 1006 southwestern limb in the 0.5−7 keV band. The regions selected for proper-motion measurements are shown in white. Central panel: azimuthal variation of the proper motion (normalized to its maximum value) in the southwestern limb of SN 1006 measured with Chandra (black crosses) and predicted by models RUN2_G (red crosses). Lower panel: same as central panel for RUN2_UN (green crosses). The dashed crosses refer to the bulge region. Error bars indicate the 1σ confidence level for the X-ray data (black solid lines) and the sensitivity errors for the models.
Current usage metrics show cumulative count of Article Views (full-text article views including HTML views, PDF and ePub downloads, according to the available data) and Abstracts Views on Vision4Press platform.
Data correspond to usage on the plateform after 2015. The current usage metrics is available 48-96 hours after online publication and is updated daily on week days.
Initial download of the metrics may take a while.