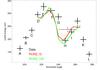
Fig. 3
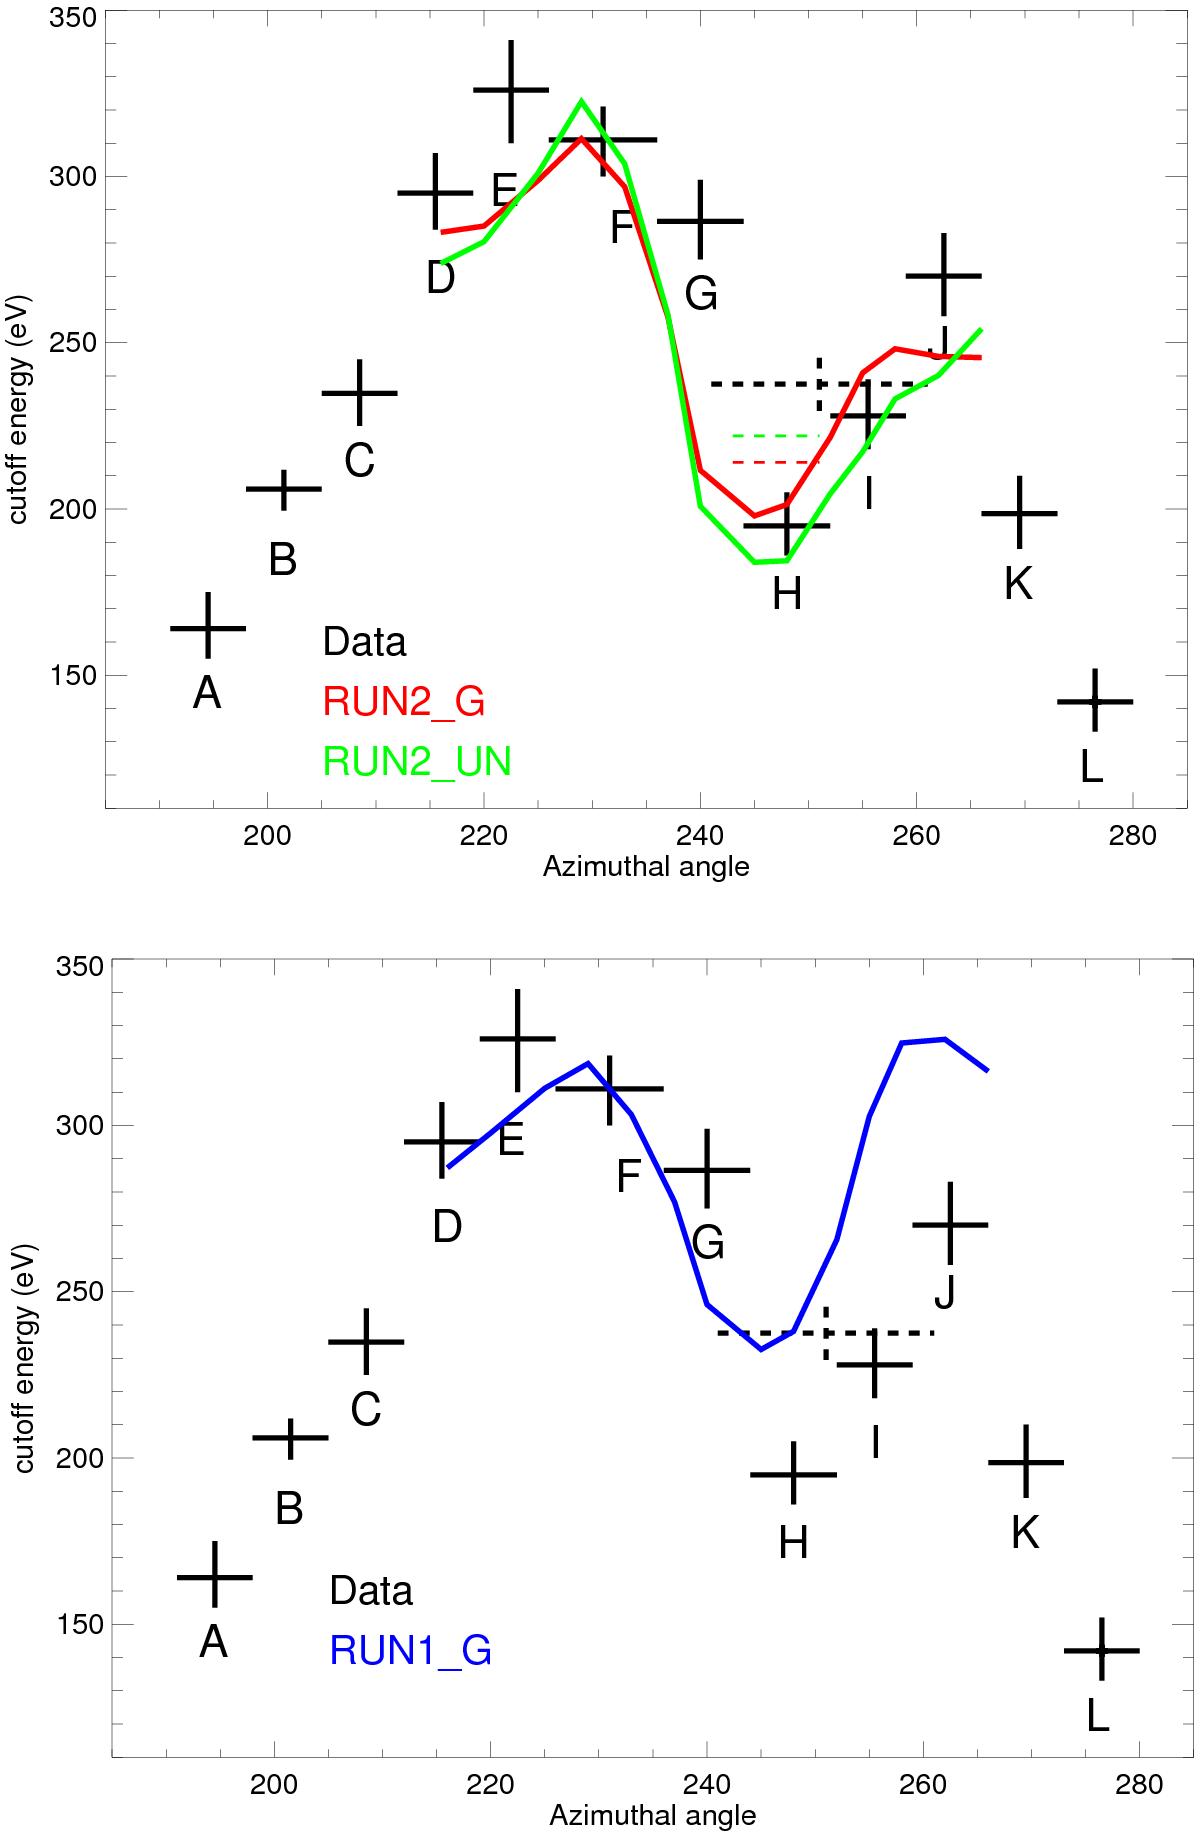
Upper panel: azimuthal variations of the synchrotron cutoff energy. The black crosses show the best fit values obtained in Paper I by analyzing the X-ray spectra extracted from regions A − L of Fig. 2, left panel (error bars indicate the 90% confidence levels). The green/red curves show the values derived from our MHD models RUN2_G and RUN2_UN, respectively, by considering the 15 regions shown in the central and right panel of Fig. 2. The dashed crosses indicate the values in the bulge region. Lower panel: same as upper panel for model RUN1_G (blue curve).
Current usage metrics show cumulative count of Article Views (full-text article views including HTML views, PDF and ePub downloads, according to the available data) and Abstracts Views on Vision4Press platform.
Data correspond to usage on the plateform after 2015. The current usage metrics is available 48-96 hours after online publication and is updated daily on week days.
Initial download of the metrics may take a while.