Fig. 4
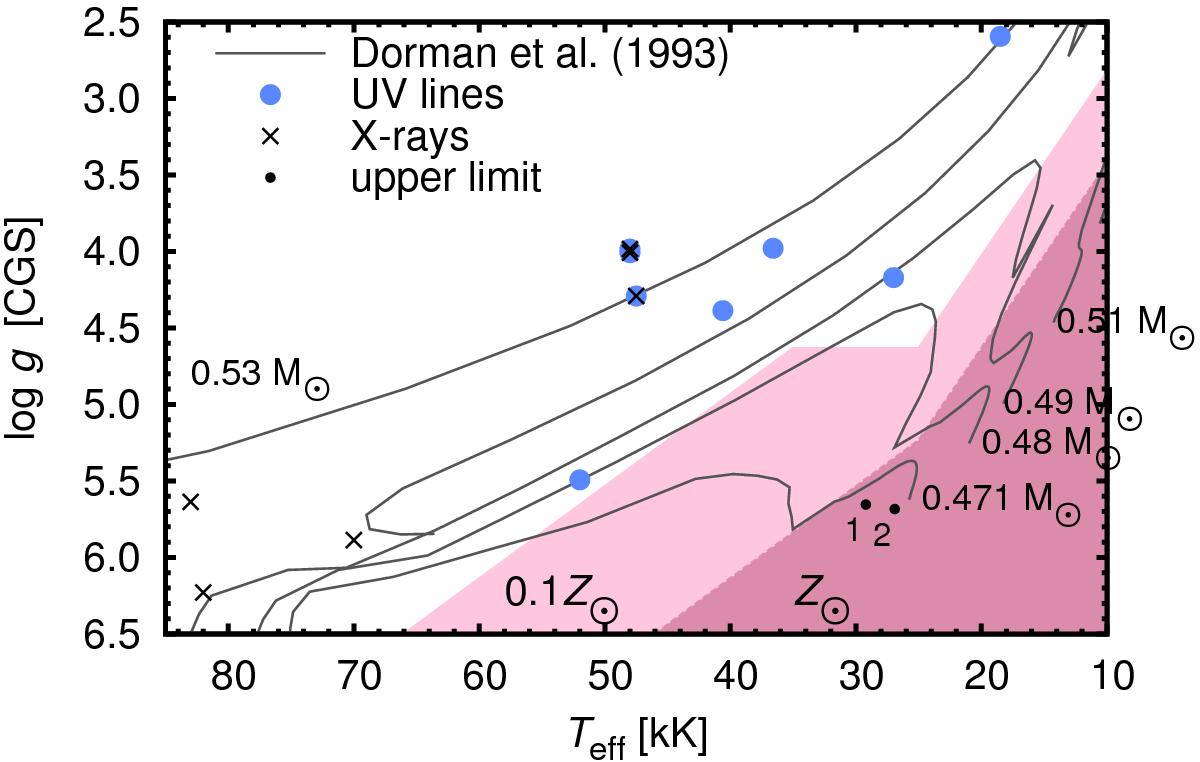
Position of a region with no predicted wind in the Teff vs. log g diagram for two different metallicities (two shades of red regions). Overplotted are the evolutionary tracks of Dorman et al. (1993) and the positions of subdwarf stars with known mass-loss rates derived from observed UV wind-line profiles (blue circles) and X-ray emission (black crosses) – see Tables 2 and 3. Small black dots denote the positions of stars CD-30 11223 (1) and PG1232-136 (2).
Current usage metrics show cumulative count of Article Views (full-text article views including HTML views, PDF and ePub downloads, according to the available data) and Abstracts Views on Vision4Press platform.
Data correspond to usage on the plateform after 2015. The current usage metrics is available 48-96 hours after online publication and is updated daily on week days.
Initial download of the metrics may take a while.