Fig. 10
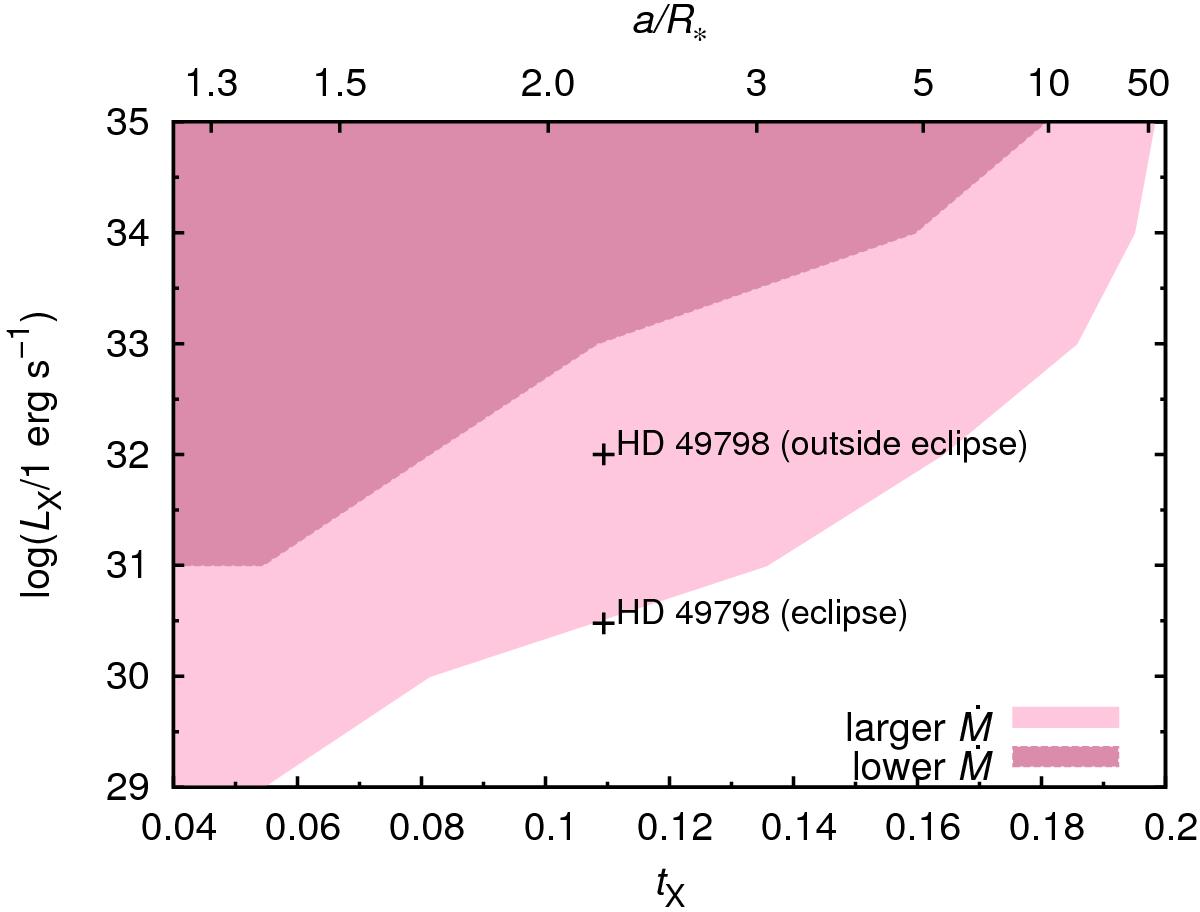
Diagram of the X-ray luminosity LX versus the optical depth parameter tX. The dark red area indicates the region of parameters, where X-rays inhibit the stellar wind, the light red area indicates the region of parameters, where X-rays increase the mass-loss rate, and there is no strong effect of X-rays on the mass-loss rate in the white area. Overplotted is the position of the star HD 49798, corresponding to time period of X-ray eclipse and time period outside the X-ray eclipse (with LX ≈ 1032 erg s-1, Mereghetti et al. 2013).
Current usage metrics show cumulative count of Article Views (full-text article views including HTML views, PDF and ePub downloads, according to the available data) and Abstracts Views on Vision4Press platform.
Data correspond to usage on the plateform after 2015. The current usage metrics is available 48-96 hours after online publication and is updated daily on week days.
Initial download of the metrics may take a while.