Fig. 7
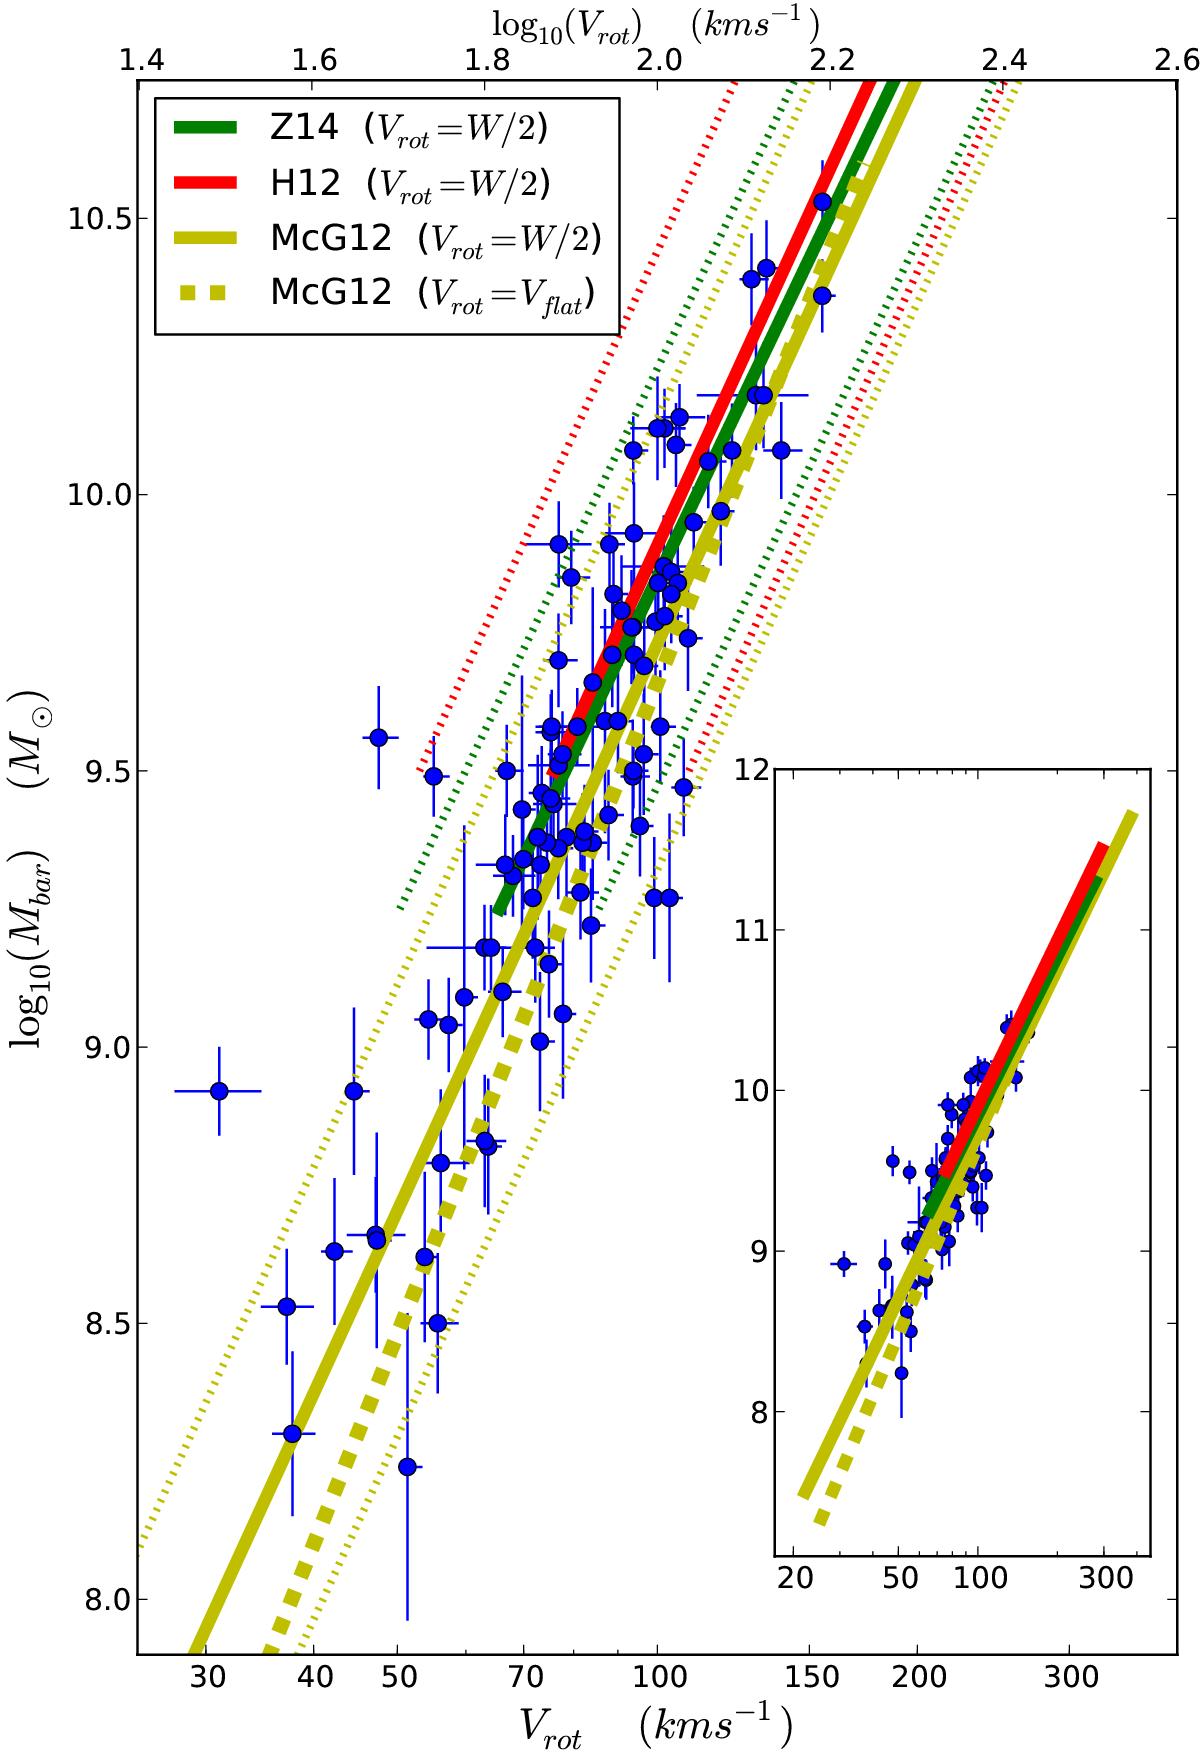
Comparison of the BTFR measured here to literature results. Main figure: blue datapoints with errorbars are the galaxies in the α.btfr sample (same as in Fig. 2). The green, red, and yellow solid lines are linear fits to the BTFR as reported by Zaritsky et al. (2014, Z14), Hall et al. (2012, H12), and McGaugh (2012, McG12) respectively. The dotted colored lines denote the ±2σ observed scatter of galaxies about the corresponding fit. All three literature results are directly comparable to the α.btfr measurement, since they all refer to linewidth-derived rotational velocities (Vrot= W/ 2). The yellow dashed line corresponds to the BTFR measured in terms of Vflat by McGaugh (2012), based on a subsample of their galaxies with spatially resolved HI kinematics. All literature fits to the BTFR extend over the range in baryonic mass probed by the corresponding measurement. Inset panel: same as in the main figure but zoomed-out, in order to illustrate the full range of baryonic mass covered by the three literature studies.
Current usage metrics show cumulative count of Article Views (full-text article views including HTML views, PDF and ePub downloads, according to the available data) and Abstracts Views on Vision4Press platform.
Data correspond to usage on the plateform after 2015. The current usage metrics is available 48-96 hours after online publication and is updated daily on week days.
Initial download of the metrics may take a while.