Fig. 4
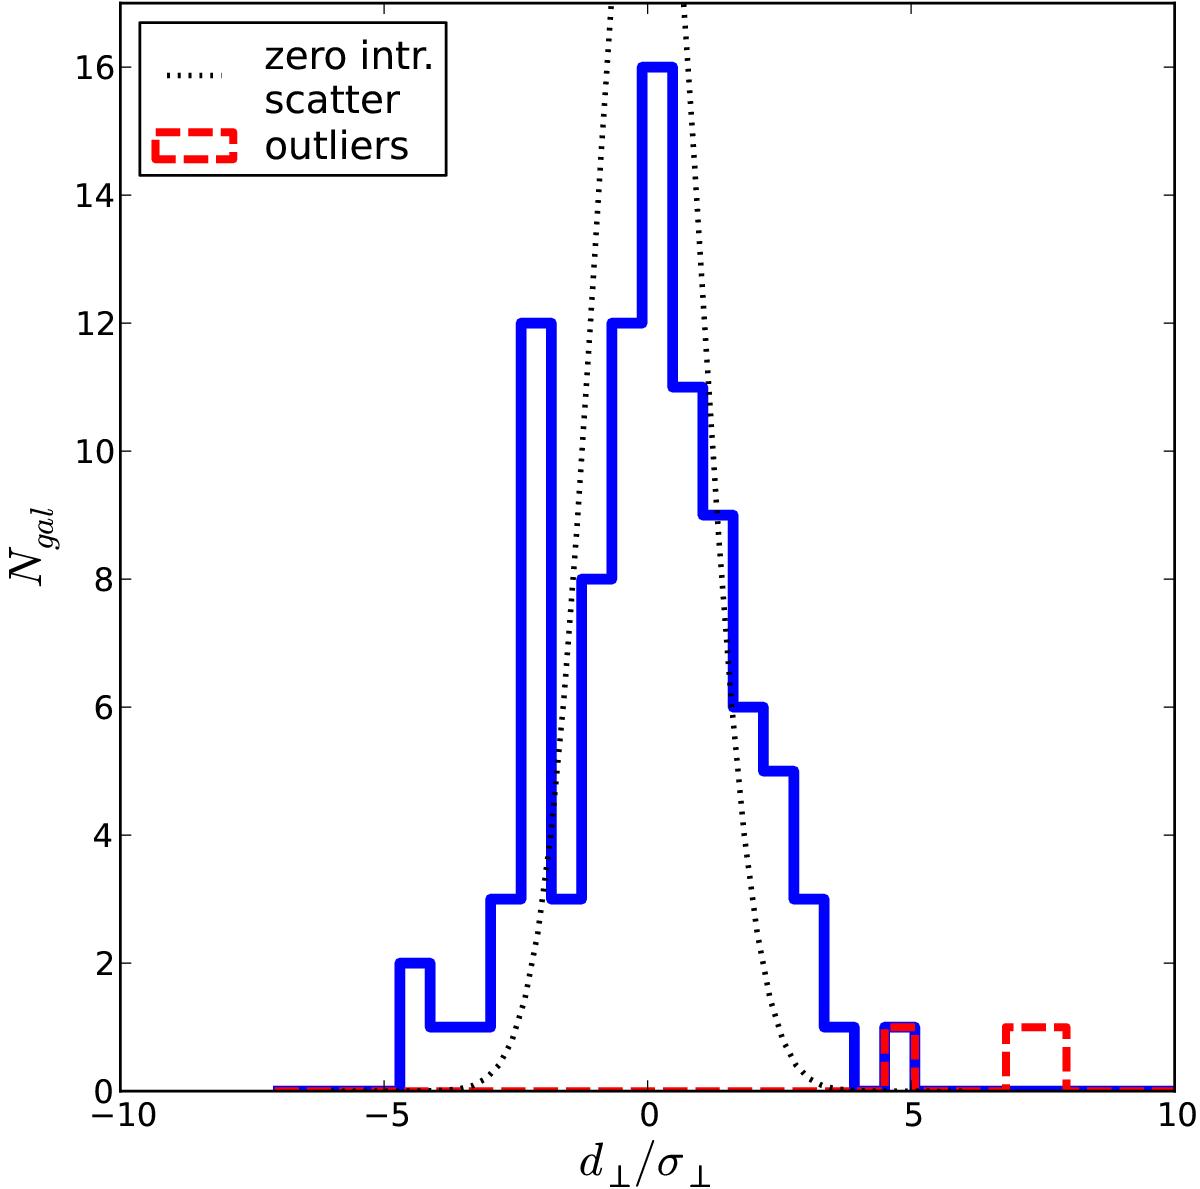
Histogram of normalized perpendicular distances for α.btfr galaxies. The blue histogram represents the distribution of d⊥ ,i/σ⊥ ,i, which is the perpendicular distance of a α.btfr datapoint from the fit line, normalized by the perpendicular error for the specific datapoint (refer to Fig. 3). The thin dotted line is a standard normal distribution, which is the expected distribution for a zero intrinsic scatter relation.
Current usage metrics show cumulative count of Article Views (full-text article views including HTML views, PDF and ePub downloads, according to the available data) and Abstracts Views on Vision4Press platform.
Data correspond to usage on the plateform after 2015. The current usage metrics is available 48-96 hours after online publication and is updated daily on week days.
Initial download of the metrics may take a while.