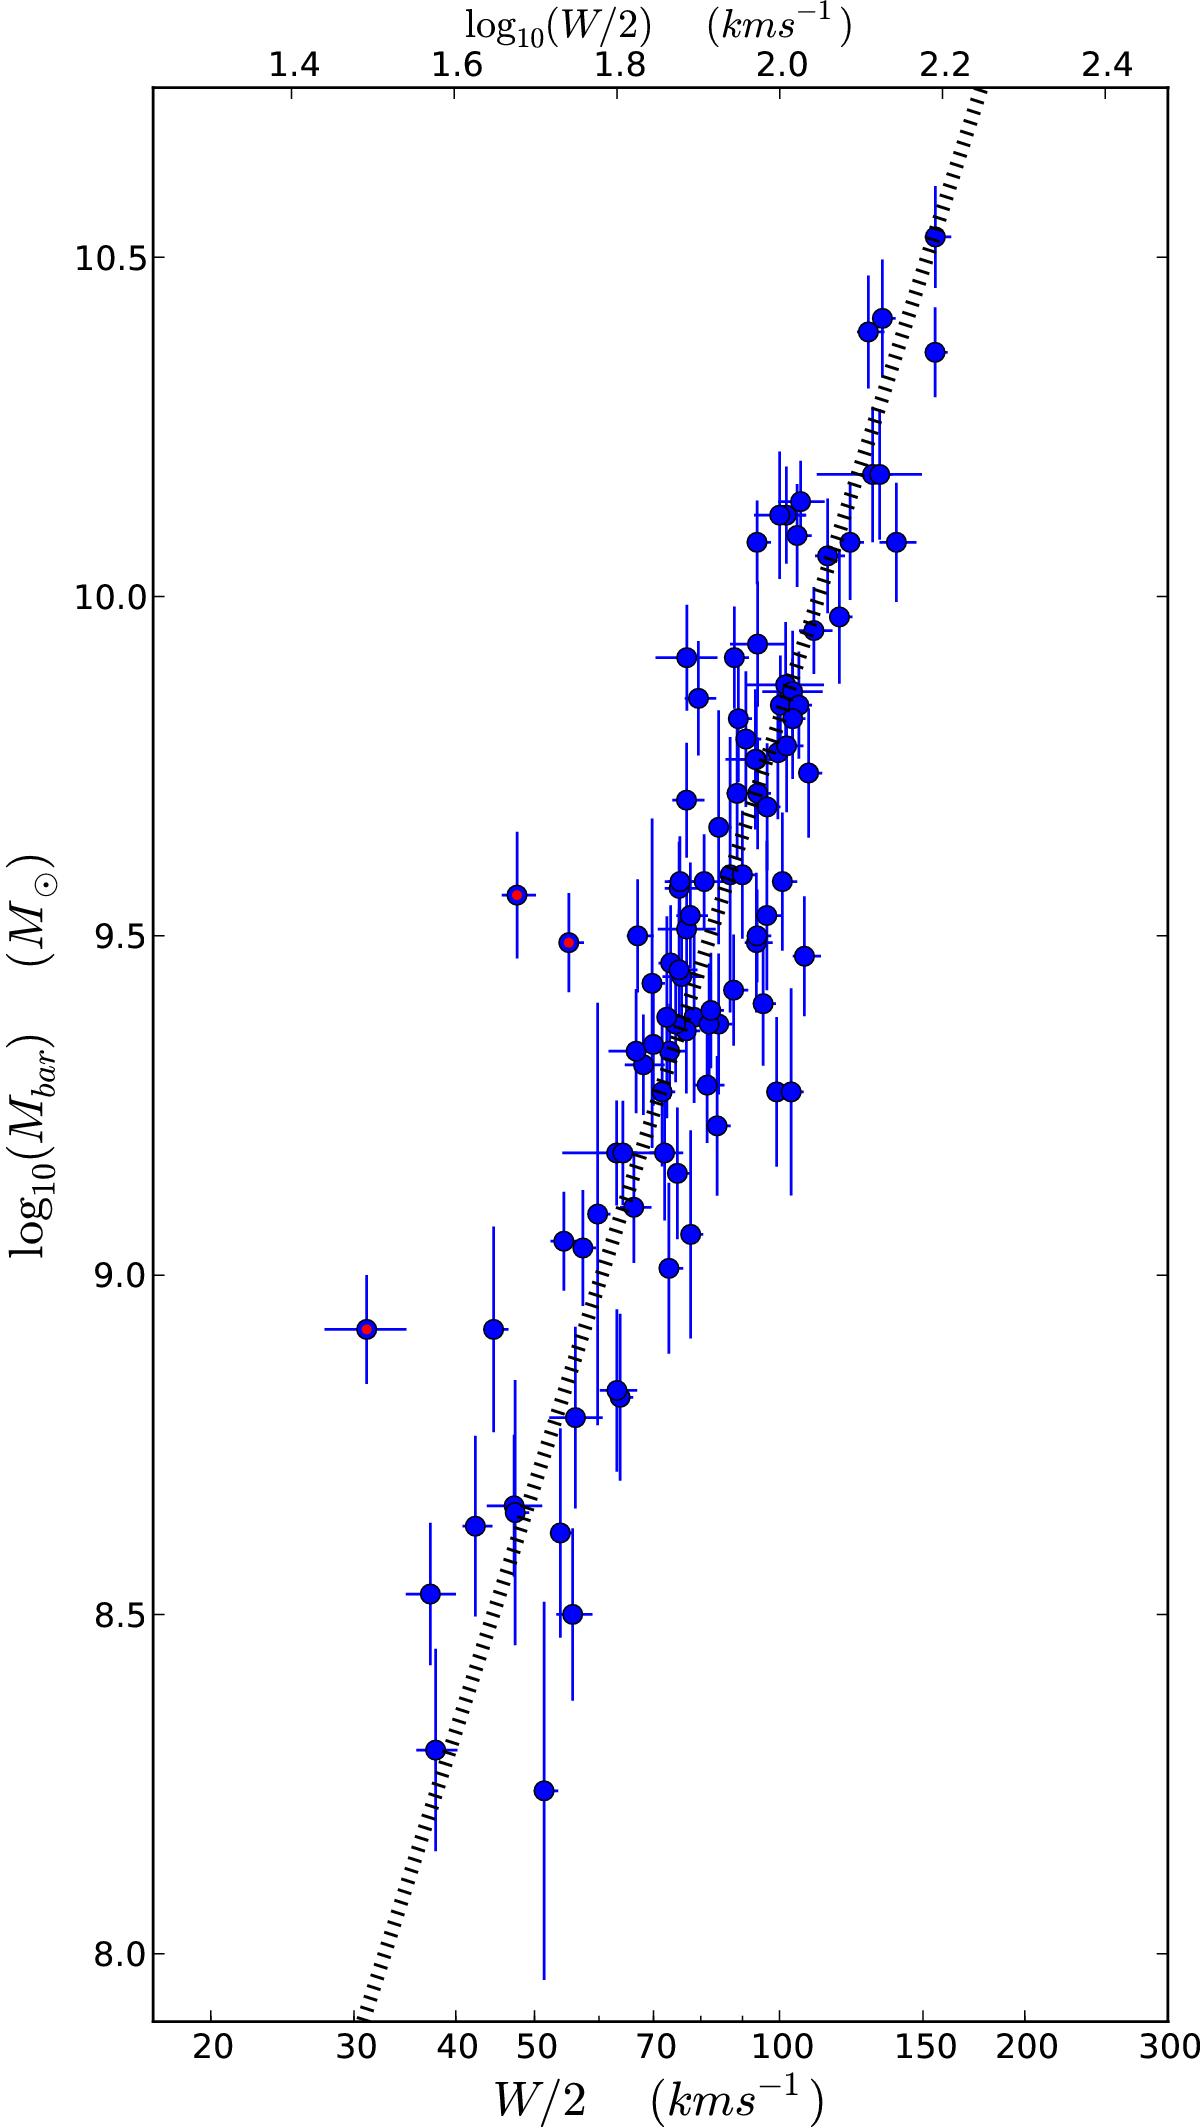
Fig. 2

BTFR of gas-dominated, edge-on galaxies. Blue circles represent the 97 galaxies in the α.btfr sample, which is selected from the ALFALFA survey (see Sect. 2.1). The values of rotational velocity and baryonic mass, as well as their errors, have been computed as described in Sect. 3. The three outliers to the relation are marked by a red dot superimposed on their symbol. The thick dotted line represents the best linear fit to the BTFR (excluding outliers), which has a slope of α = 3.58 ± 0.11.
Current usage metrics show cumulative count of Article Views (full-text article views including HTML views, PDF and ePub downloads, according to the available data) and Abstracts Views on Vision4Press platform.
Data correspond to usage on the plateform after 2015. The current usage metrics is available 48-96 hours after online publication and is updated daily on week days.
Initial download of the metrics may take a while.


