Fig. B.6
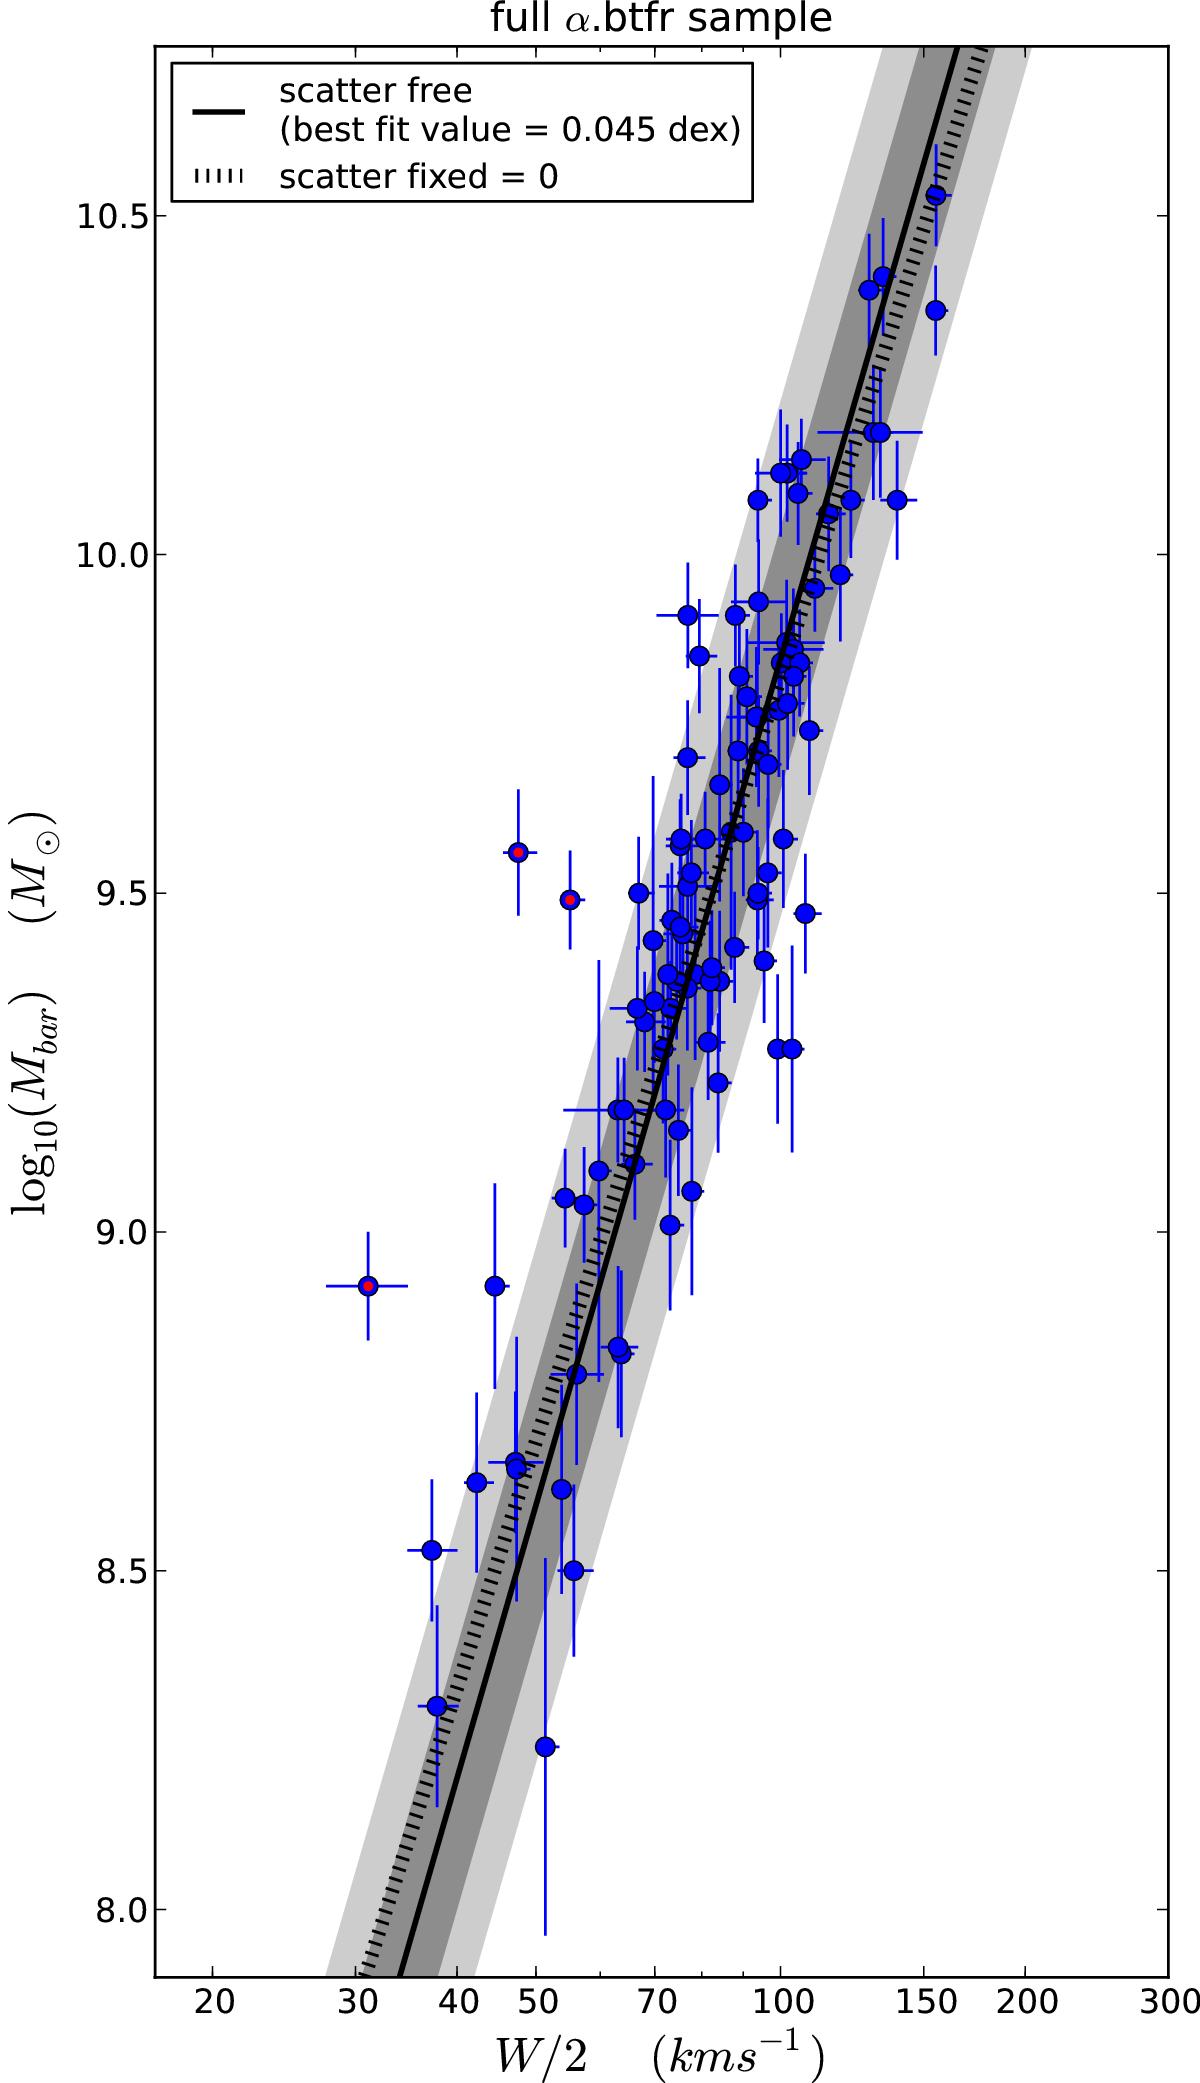
Comparison of the linear fit to the BTFR of the full α.btfr sample with and without intrinsic scatter included in the model. Comparison of the linear fit to the BTFR of the full α.btfr sample with and without intrinsic scatter included in the model. The layout of the figure follows that of Fig. 2. The thick dotted line represents our fiducial no-scatter fit, and is the same as the thick dotted line in Fig. 2. The thin solid line represents the best fit line when intrinsic scatter is treated as a free parameter. The gray shaded bands represent the 1σ and 2σ intrinsic scatter regions according to the best fit value of the parameter σ⊥ ,intr = 0.045 dex.
Current usage metrics show cumulative count of Article Views (full-text article views including HTML views, PDF and ePub downloads, according to the available data) and Abstracts Views on Vision4Press platform.
Data correspond to usage on the plateform after 2015. The current usage metrics is available 48-96 hours after online publication and is updated daily on week days.
Initial download of the metrics may take a while.