Fig. B.4
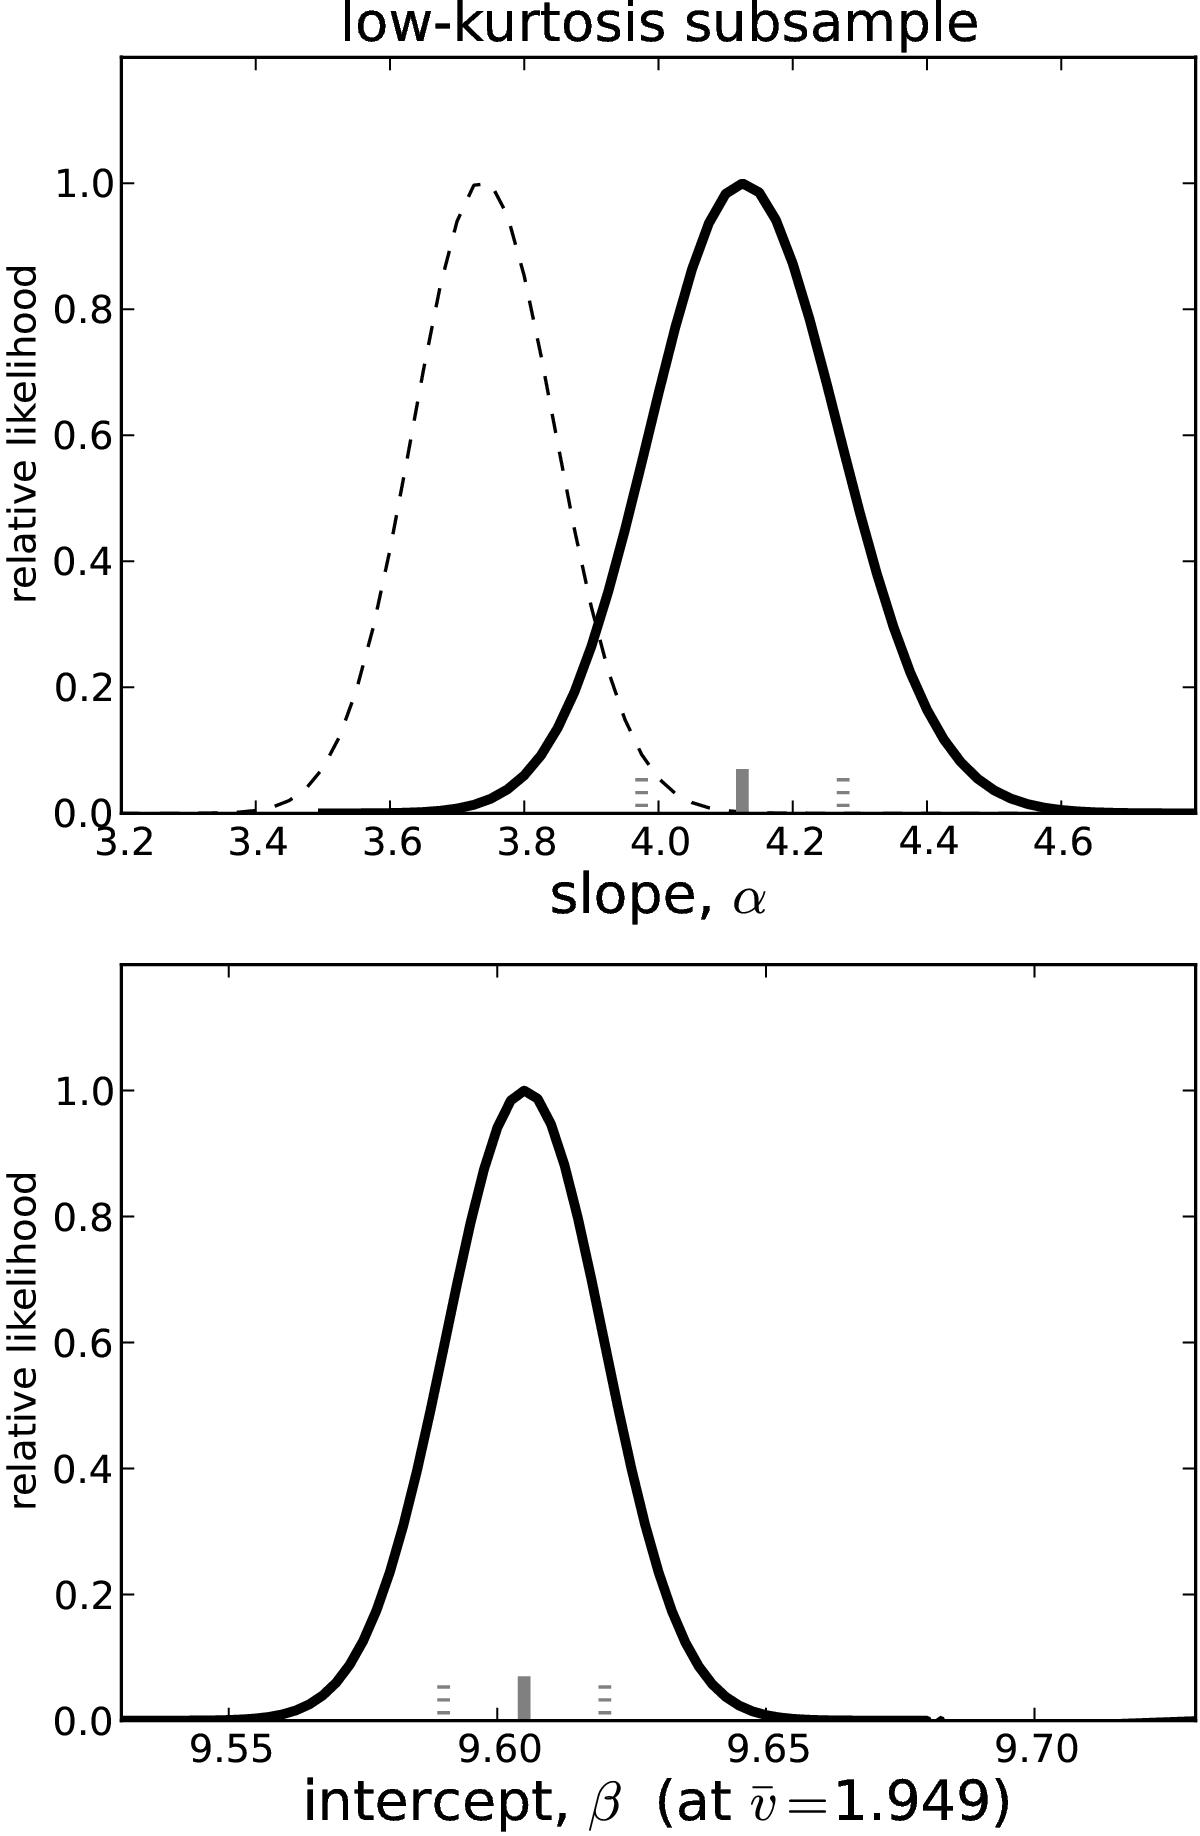
Top panel: same as the top panel of Fig. B.2, but for the case of the low-kurtosis subsample of α.btfr galaxies. The maximum likelihood slope for this subsample is α = 4.14 ± 0.14. The likelihood distribution of the slope for the full α.btfr sample is also plotted as a thin dashed line, for comparison. Bottom panel: same as the bottom panel of Fig. B.2, but for the case of the low-kurtosis subsample of α.btfr galaxies. The maximum likelihood intercept for this subsample is β = 9.605 ± 0.015, and refers to a pivot value of ![]() . Keep in mind that the pivot values for the full α.btfr sample and for the low-kurtosis subsample are different.
. Keep in mind that the pivot values for the full α.btfr sample and for the low-kurtosis subsample are different.
Current usage metrics show cumulative count of Article Views (full-text article views including HTML views, PDF and ePub downloads, according to the available data) and Abstracts Views on Vision4Press platform.
Data correspond to usage on the plateform after 2015. The current usage metrics is available 48-96 hours after online publication and is updated daily on week days.
Initial download of the metrics may take a while.