Fig. A.2
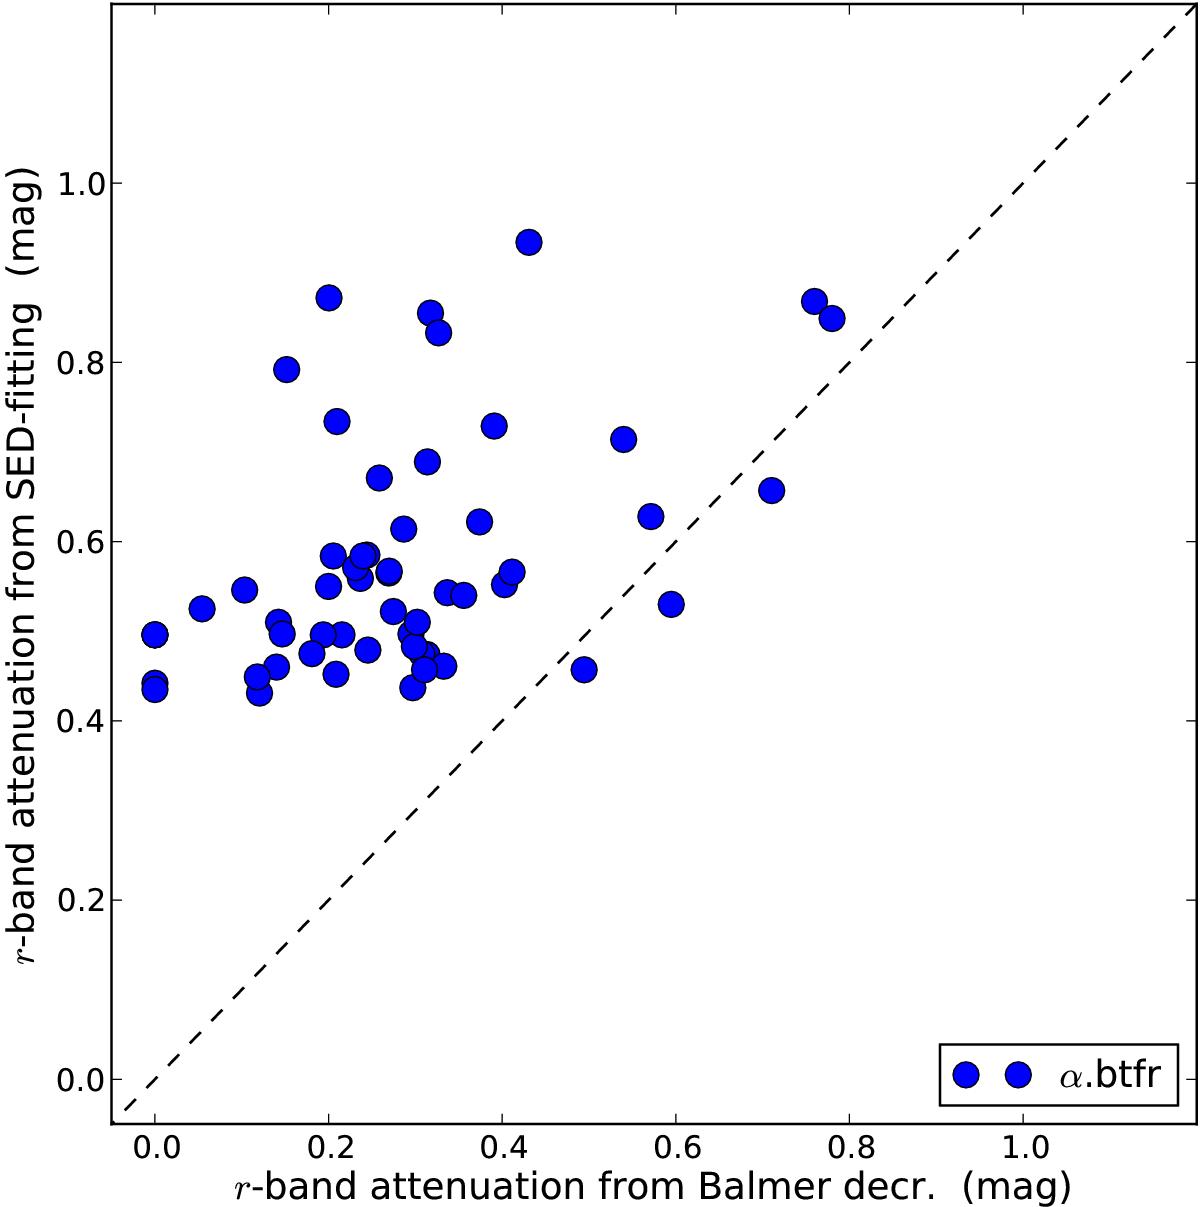
Comparison of internal extinction derived from Balmer decrements and SED fitting. The x-axis corresponds to the r-band attenuation for the α.btfr galaxies implied by their Balmer decrements (Eq. (A.2)). The y-axis corresponds to the r-band attenuation inferred during the process of SED fitting used to calculate ![]() (refer to method i in Sect. 3.4). The dashed black line is a one-to-one reference line.
(refer to method i in Sect. 3.4). The dashed black line is a one-to-one reference line.
Current usage metrics show cumulative count of Article Views (full-text article views including HTML views, PDF and ePub downloads, according to the available data) and Abstracts Views on Vision4Press platform.
Data correspond to usage on the plateform after 2015. The current usage metrics is available 48-96 hours after online publication and is updated daily on week days.
Initial download of the metrics may take a while.