Fig. 9
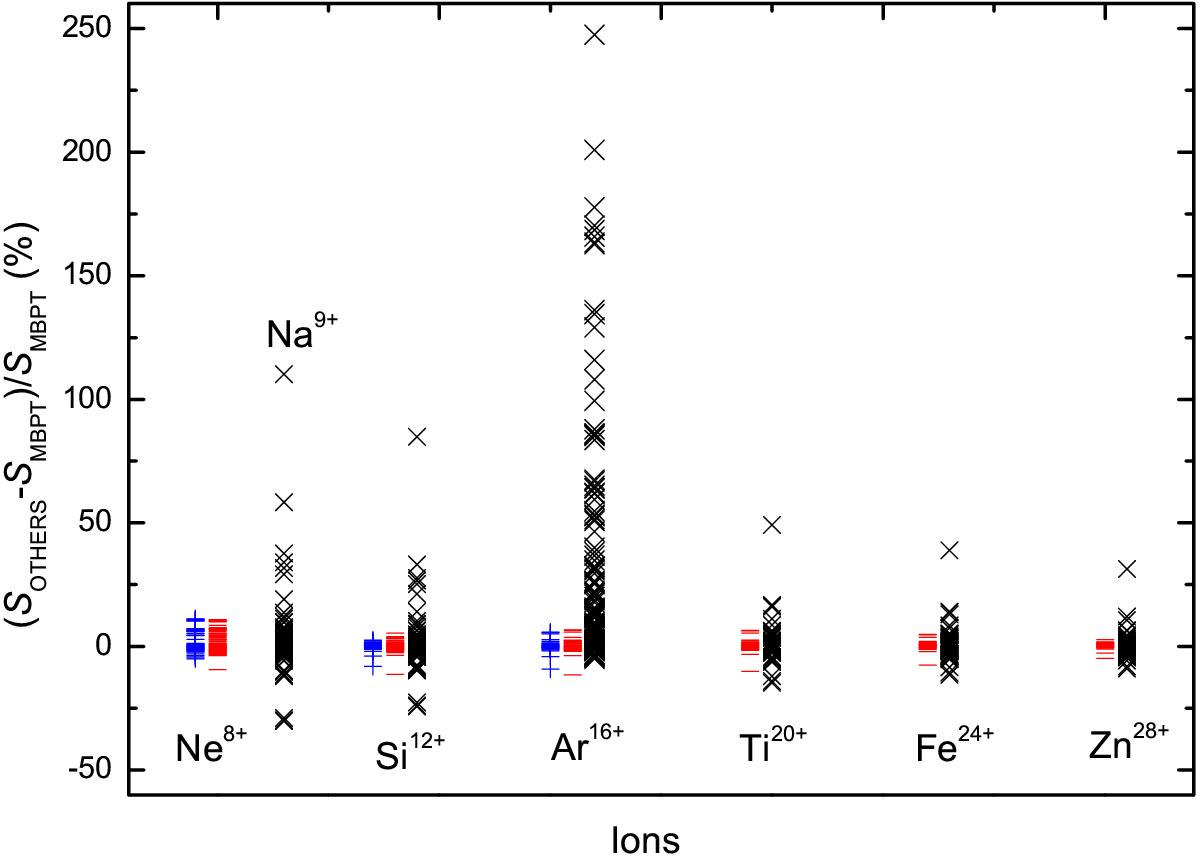
Comparisons of our MBPT S values for resonance E1 transitions among singly excited levels for Z = 10,14,18,22,26,30 with other theoretical values, i.e., our MCDHF results (bar), values from Savukov et al. (2003; plus) and Aggarwal et al. (2005, 2009, 2010, 2012d, 2013a; cross). Since Aggarwal et al. did not provide values for Z = 10, the differences for Z = 11 are plotted instead.
Current usage metrics show cumulative count of Article Views (full-text article views including HTML views, PDF and ePub downloads, according to the available data) and Abstracts Views on Vision4Press platform.
Data correspond to usage on the plateform after 2015. The current usage metrics is available 48-96 hours after online publication and is updated daily on week days.
Initial download of the metrics may take a while.