Fig. 4
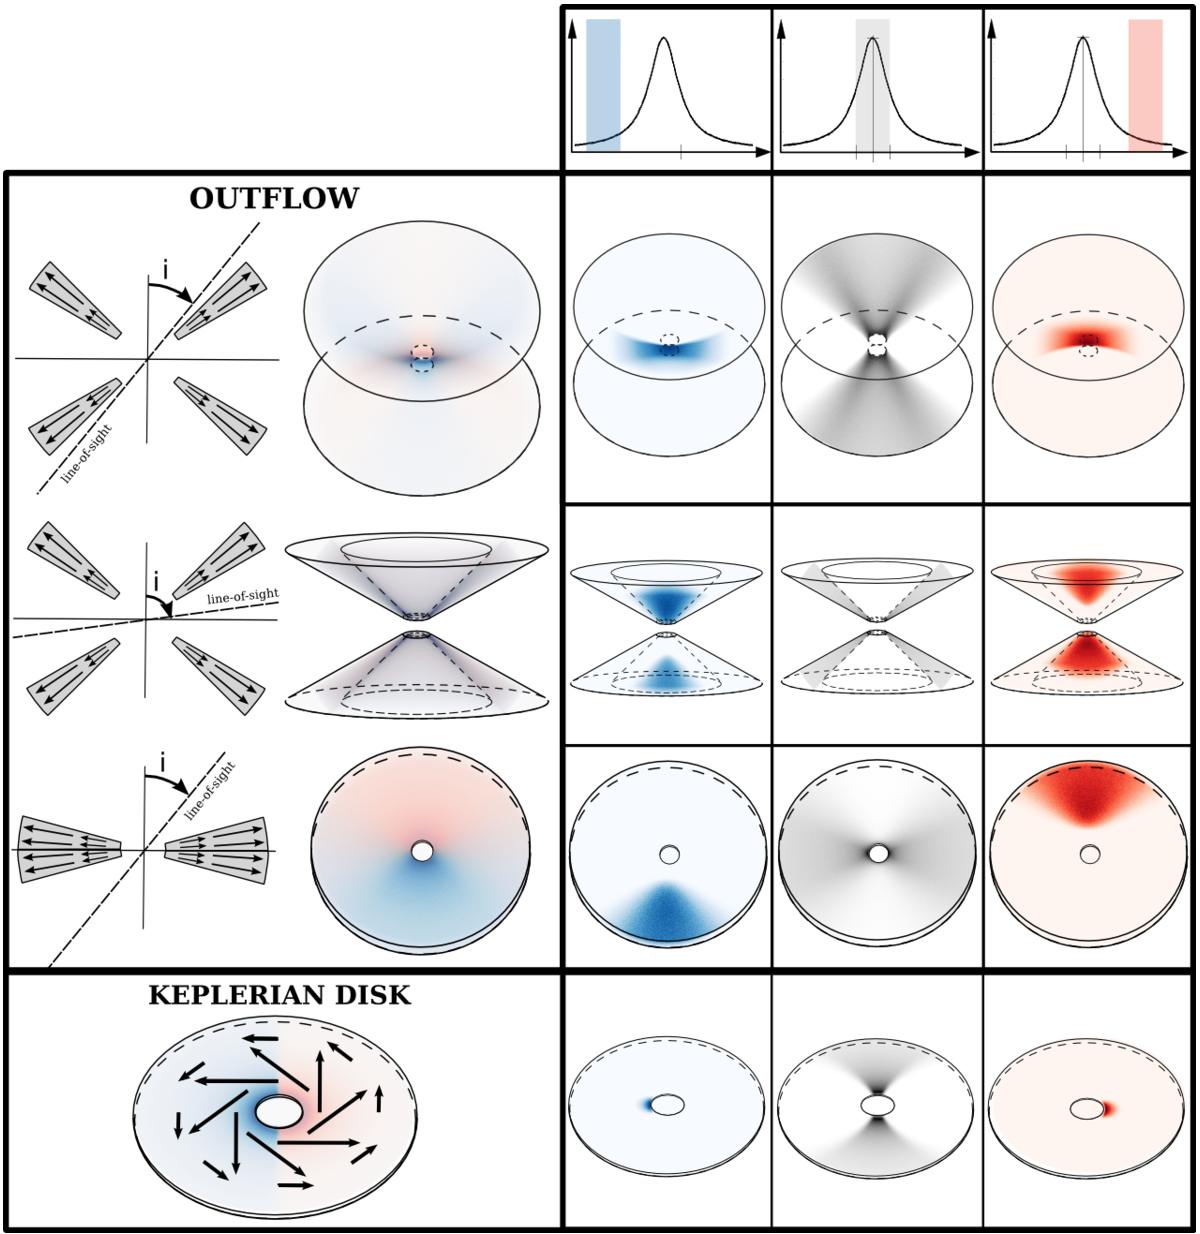
Emission regions of the highly blueshifted, highly redshifted, and low-velocity line flux, illustrated for different BLR models: a polar wind with a conical shell geometry (rows 1 and 2), an equatorial wind (row 3), and a Keplerian disk (row 4). The winds are radially accelerated. Their radial outflow is plotted in the left side of the outflow panel, in the plane of the observer line-of-sight for readability. The velocity fields are mapped with vectors, whose length is representative of the speed. Velocity slices are highlighted on the line profile drawn in the top of the figure, and the area of the BLR velocity field with matching projected velocities are plotted in the corresponding column. This figure is based on simulations of the emissivity of different BLR models, which will be the subject of a future paper.
Current usage metrics show cumulative count of Article Views (full-text article views including HTML views, PDF and ePub downloads, according to the available data) and Abstracts Views on Vision4Press platform.
Data correspond to usage on the plateform after 2015. The current usage metrics is available 48-96 hours after online publication and is updated daily on week days.
Initial download of the metrics may take a while.