Fig. 3
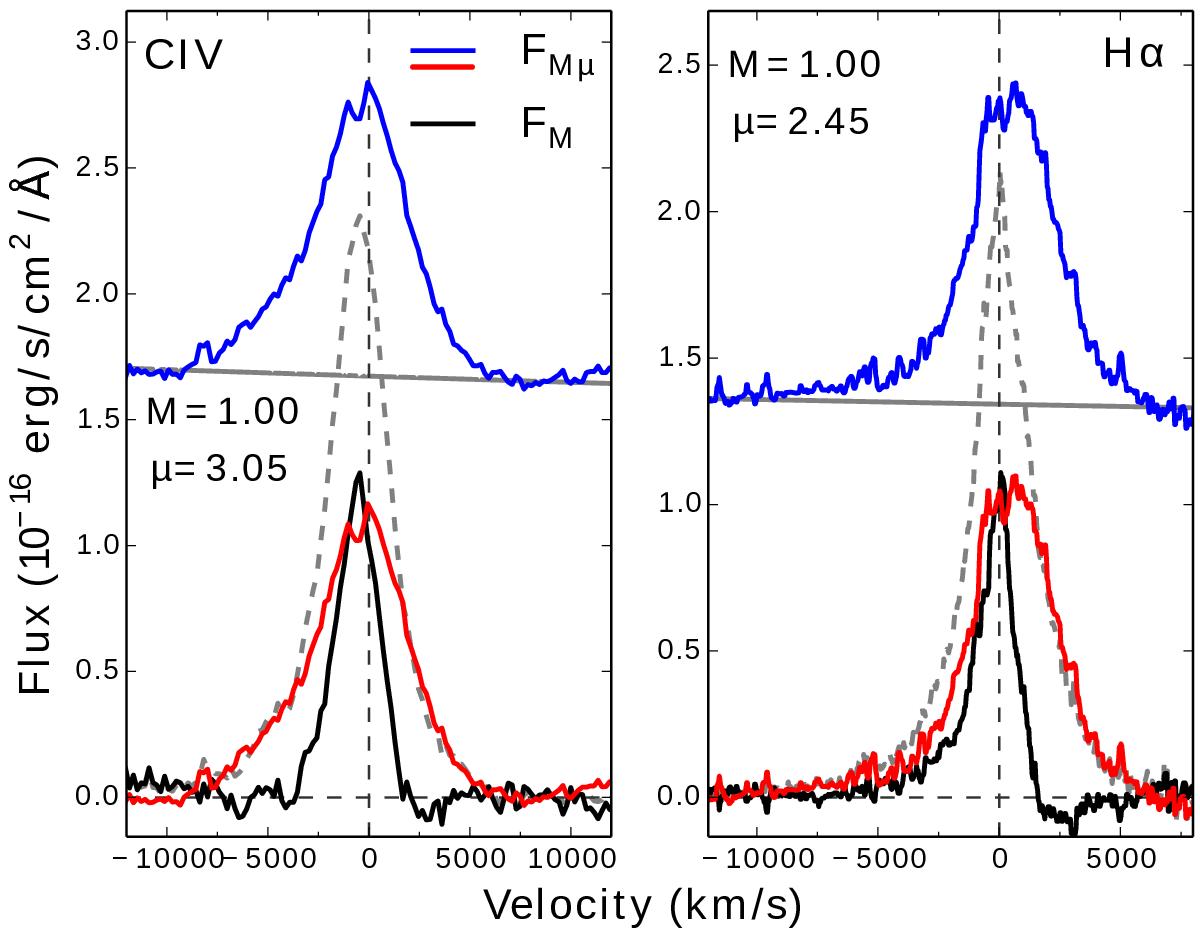
Spectrum of quasar image A decomposed into a microlensed component FMμ (solid blue line) and a component FM (solid black line) which is supposed to be unaffected by microlensing. The microlensed part of the line profile, plotted with a solid red line, is obtained by subtracting the continuum from the microlensed component. Continuum level is indicated by a solid grey line. For clarity, the microlensed spectrum (blue line) is shifted up by 0.5 × 10⁻¹⁶ and 1.0 × 10⁻¹⁶ in the left and right panels respectively. CIV and Hα line profiles observed in image D, which is supposed to be unaffected by microlensing, are plotted by a dashed gray line. The CIV line profile was corrected for the intervening absorption, clearly visible in Fig. 2c, before applying MmD. The macro-amplification ratio, M, and the additional magnification caused by microlensing, μ, determined for each line are indicated. Wavelengths are expressed in the quasar reference frame and converted into Doppler velocity shift, relative to the line laboratory wavelength.
Current usage metrics show cumulative count of Article Views (full-text article views including HTML views, PDF and ePub downloads, according to the available data) and Abstracts Views on Vision4Press platform.
Data correspond to usage on the plateform after 2015. The current usage metrics is available 48-96 hours after online publication and is updated daily on week days.
Initial download of the metrics may take a while.