Fig. 2
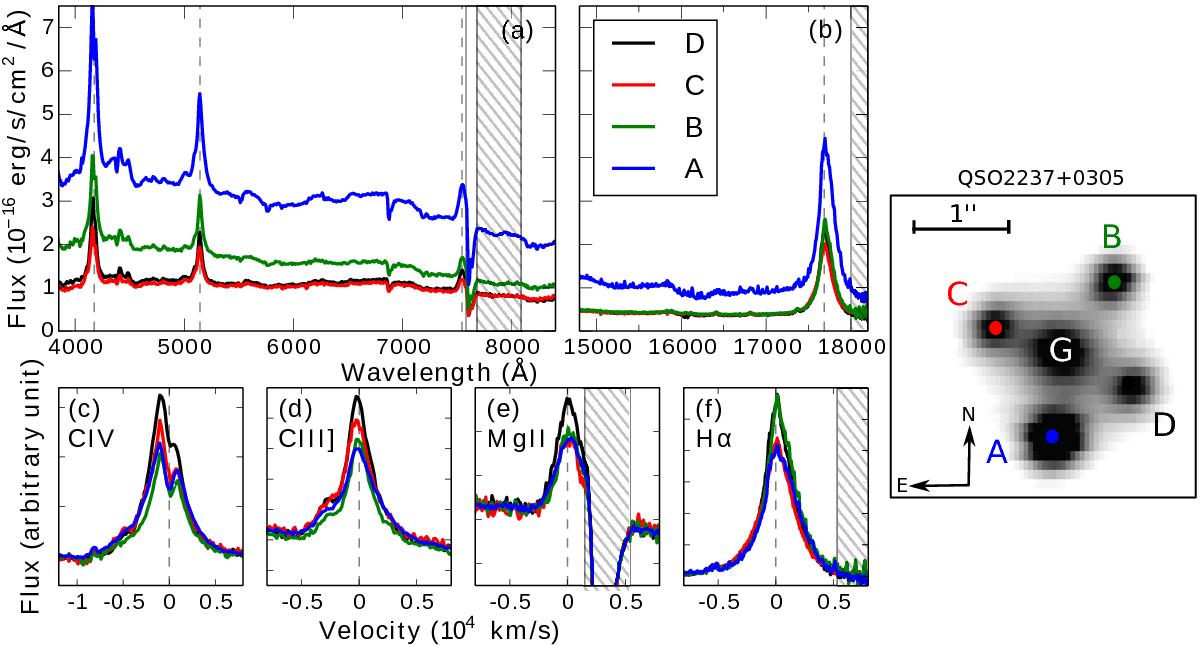
a) Visible spectra of the four images of QSO2237+0305 acquired on October 11 2005. b) Mean near-infrared spectra obtained by combining all the valid spectra secured in October 2005. A typical SINFONI image of the QSO2237+0305 system, obtained by integrating the infrared flux over wavelength, is illustrated in the right panel. c)–f) Zoom on the CIV, CIII], MgII and Hα line profiles, plotted vs. the Doppler shift relative to the line laboratory wavelength redshifted to the quasar rest-frame. The spectra were rescaled so that their continua superimpose in the neighborhood of the lines. Vertical dotted lines indicate the positions of the lines in the quasar rest-frame. Hatched surfaces cover the wavelength ranges that suffer from important atmospheric absorption. The spectra are smoothed in wavelength using a 3-pixel wide median filter.
Current usage metrics show cumulative count of Article Views (full-text article views including HTML views, PDF and ePub downloads, according to the available data) and Abstracts Views on Vision4Press platform.
Data correspond to usage on the plateform after 2015. The current usage metrics is available 48-96 hours after online publication and is updated daily on week days.
Initial download of the metrics may take a while.