| Issue |
A&A
Volume 592, August 2016
|
|
|---|---|---|
| Article Number | A35 | |
| Number of page(s) | 10 | |
| Section | Interstellar and circumstellar matter | |
| DOI | https://doi.org/10.1051/0004-6361/201628525 | |
| Published online | 18 July 2016 | |
Irradiation of astrophysical ice grains by cosmic-ray ions: a REAX simulation study
Physics Department and Research Center OPTIMAS, University Kaiserslautern, Erwin-Schrödinger-Straße, 67663 Kaiserslautern, Germany
e-mail: This email address is being protected from spambots. You need JavaScript enabled to view it.
Received: 16 March 2016
Accepted: 8 May 2016
Abstract
Context. The impact of cosmic rays on ice grains delivers considerable energy, inducing chemical reactions and molecule ejection.
Aims. We study the effects of cosmic ray impact on ice grains, including shock wave expansion, grain heating, molecule fragmentation, formation of chemical reaction products, sputtering and evaporation.
Methods. Molecular-dynamics simulations using the REAX potential allow us to follow the processes occurring in the irradiated ice grain; the mechanical, thermal and chemical consequences are simulated. The ice grain consists of a mixture of water, carbon dioxide, methanol and ammonia. The case of 1 keV/nm energy deposition is studied as an example.
Results. The ion track emits a shock wave into the ambient grain. Due to the strong heating, abundant molecule fragmentation is observed; several of the fragments either recombine or form new product molecules. Prompt sputtering from the ion track is followed by evaporation from the surface of the heated grain. We present mass spectra of the chemically transformed species in the grain and in the ejecta.
Key words: astrochemistry / methods: numerical / cosmic rays / ISM: molecules
© ESO, 2016
1. Introduction
Ices are a prominent material that covers many planets, moons and small bodies in the outer solar system and in other planetary systems (Gudipati & Castillo-Rogez 2013). In addition, small ice grains – and ice-covered silicate grains – are ubiquitous in the interplanetary and interstellar medium as dust particles (Draine 2003). The composition of the ices is complex and assumed to be a mixture of various species such as H2O, NH3, CO2, and others (Bottinelli et al. 2010). The fate of these grains is governed by the further accretion of material by collisions with gas-phase molecules or other grains. In addition, they are exposed to a radiation environment that consists of both a photonic and a massive (ion) component (Baragiola et al. 2013). The latter is composed of the stellar winds (in planetary systems), magnetospheric ions (in the vicinity of planets), and cosmic radiation (everywhere). Such radiation has many effects on the grains; it may compact the material, erode it, induce phase transformations (to the amorphous phase or to other solid phases), and induce chemical transformations in the grain (Johnson 1990; Johnson et al. 2013). By ejecting material, such irradiation events may set chemically transformed material – also including highly reactive radicals – free by bringing it to the gas phase.
Since cosmic radiation presents a ubiquitous radiation source, a study of its consequences is most relevant. Due to their larger energy deposition, heavy nuclei are more relevant to study than proton irradiation, even though their fluxes are smaller (Shen et al. 2004). Energies have a broad maximum at 10–100 MeV/amu. Estimations of the flux density show that the flux of so-called heavy nuclei (12 ≤ Z ≤ 29) with energies between 0.1 and 10 MeV/amu is around 0.05 cm-2 s-1 and hence dominates over the solar wind flux already beyond the Mars orbit (Pilling et al. 2010b, Fig. 8).
The effects of energetic particle irradiation of ices has recently been studied using controlled laboratory experiments, in which ice samples are irradiated by energetic heavy ions; an overview is given by Allodi et al. (2013). Among the ices studied are water ice and mixtures with carbon dioxide and ammonia (Pilling et al. 2010b; Bordalo et al. 2013), ammonia (Pilling et al. 2010a), methanol (de Barros et al. 2011b), and methane ices (de Barros et al. 2011a). These studies report on extensive chemical transformation found in the irradiated samples.
Impact of MeV ions on matter leads to the formation of a so-called ion track (Fleischer et al. 1975). The physics is as follows: the swift ion delivers its energy to the electronic system of the target. The electrons convey their energy to the atomic system by a complex series of processes which depend in detail strongly on the molecular composition of the material. In consequence, the material is heated along the path of the ion, and thermodynamic processes (shock wave emission), chemical transformation, as well as material ejection can occur. Due to the complexity of the processes taking place in the electronic system, theoretical modeling of the processes occurring in an ion track usually starts with the time when atoms have obtained kinetic energy, and studies the subsequent processes (Johnson 1990; Toulemonde et al. 2006). Studies that incorporate the electrons in the analysis are comparatively rare and have only been performed for relatively simple materials such as LiF (Cherednikov et al. 2013).
Computer simulation on the basis of molecular dynamics (MD) offers an important theoretical tool to study the processes occurring in ion tracks. Previous simulations focused on ion tracks in plane surfaces. They started with studies of the sputtering of large organic molecules from tracks by Fenyö et al. (1990). Urbassek et al. (1994) reported on the influence of track radius and energy on the sputtering of a model Lennard-Jones solid. Later, Beuve et al. (2003) studied the influence of the spatial and temporal structure of the deposited-energy distribution on the sputtering process, again in a model solid; this study was later continued by Mookerjee et al. (2008).
Studies of ion tracks in grains are comparatively rare. Bringa & Johnson (2002) used MD and later Bringa & Johnson (2004) a thermal model to study sputtering from ion tracks in ice grains. This model was later expanded to calculate the amorphization of grains (Bringa et al. 2007)
Processes occurring in condensed-gas targets under ion impact were studied experimentally by David & Michl (1989) and theoretically by Urbassek & Michl (1987) and Balaji et al. (1995). Later simulation work concentrated on diatomic and triatomic species (Anders & Urbassek 2007, 2009, 2010). While much work concentrated on mild energy depositions in the ice (Johnson & Liu 1996), the consequences of a track in a molecular target, N2, could also be studied (Kafemann & Urbassek 1993).
Recently, the so-called REAX potentials were developed (van Duin et al. 2001; Chenoweth et al. 2008; Liu et al. 2011) which model the breaking and re-formation of chemical bonds. These potentials are based on the bond-order idea that models the environment dependence of chemical bonds. The ionic contribution to bonding is taken into account by dynamically calculating the partial charges of each atom. These potentials thus allow one to study ion impact on molecular targets and to monitor the dissociations and molecular reactions occurring. These potentials were used by Anders & Urbassek (2013) to study collisions between ice clusters and single-ion impact into an ice target.
In the present paper, we use MD simulations based on the REAX potentials to investigate the processes occurring in an ion track in an ice grain. We use a specific mixture presented by Martins et al. (2013) and focus attention on an ion track that is characterized by an energy deposition of 1 keV/nm and a track radius of 5 Å. In addition, an ion track with doubled radius is studied. We report on shock wave emission from the track, ejection of atoms, molecules and clusters and on the chemical transformations in the target and in the ejecta.
2. Method
2.1. Ice grain and interaction potential
The ice grain consists of a mixture of H2O, CO2, NH3, and CH3OH with molar ratios of 9.10:8.00:3.75:1.00. This mixture was proposed by Martins et al. (2013) in their study of shock wave interaction with ices; a similar mixture has been used by us previously to study ice grain collisions (Anders & Urbassek 2013). Several physico-chemical parameters of the species are assembled in Table 1. We prepare a spherical grain with a radius of 89 Å by using PACKMOL (Martínez et al. 2009) to put a total of 225, 864 atoms – 28, 428 H2O, 24, 992 CO2, 11, 715 NH3, and 3, 124 CH3OH molecules – into the sphere and to generate an amorphous structure. The grain was relaxed for a time of 50 ps in order to remove excess kinetic energy and reduce the pressure to zero. After relaxation, the grain has a radius of 93 Å, an average density of 0.070 Å-3 and a density in the center of 0.074 Å-3. Its temperature is 1 K.
Physico-chemical properties of the molecular species originally present in the ice mixture.
We use the REAX potential developed by Van Duin et al. (van Duin et al. 2001; Chenoweth et al. 2008; Liu et al. 2011) to model the intra- and intermolecular interactions in this ice mixture. Note that this potential also allows us to model molecular fragmentation and reactions. We use the potential parameters in its latest form (Monti et al. 2012), since this potential was optimized for the amino acid glycine, and this amino acid contains all relevant atom types for the present study. Towards higher energies we add the Ziegler-Biersack-Littmark (ZBL) potential (Ziegler et al. 1985) to model the repulsive short-range interaction. We have described the details of the combination of the REAX and ZBL potentials previously (Anders & Urbassek 2013).
2.2. Simulation procedure
The simulations are performed using the massively parallel open-source code LAMMPS (Plimpton 1995). It uses a variable time step which varies from initially 0.01 to finally 0.1 fs. The simulation runs until 49.3 ps after ion-track formation.
We form an initial “ion track” in the grain as follows. The ion is assumed to pass along a sphere diameter L = 182.3 Å through the center of the grain. In a cylindrical region with radius r = 5 Å around the ion path, we deposit an energy of dE/dx = 1 keV/nm, i.e., in total Edep = L·dE/ dx = 18.23 keV is deposited in the grain. We note that such an (electronic) energy deposition corresponds, for example, to the stopping of a 3.5 MeV Fe ion in the ice mixture according to the SRIM code (Ziegler 2004), but is by no means the maximum deposition which is achieved for faster projectiles. The track radius is small compared to the grain radius. The energy is given to each atom in the geometrical ion-track region as kinetic energy; each of the Ntrack = 1101 track atoms receives on average a kinetic energy of E0 = Edep/Ntrack = 16.56 eV, but with random direction. In detail, the code samples the individual track atom velocities from a three-dimensional Maxwellian velocity distribution with temperature E0/ 3k = 64.04 kK, where a specific heat of 3k per atom is assumed and k is Boltzmann’s constant, The subroutine “velocity track create” within the LAMMPS code ensures that the total momentum and the total angular momentum of the grain vanish. Figure 1 gives an impression of the grain containing the heated track shortly after track initiation.
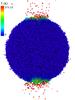 |
Fig. 1 Snapshot of the irradiated grain at a time of 1.6 ps after track formation. Color denotes the local temperature. Figure prepared with OVITO (Stukowski 2010). |
We can calculate the equilibrium temperature, Tequ, that the grain will reach at long times after track formation via  (1)With the values given above, and the total number of atoms N in the grain, the equilibration temperature amounts to Tequ = 304 K. We note that this is a gross estimate since the energy used for bond breaking, energy losses due to phase changes (melting and evaporation) and particle ejection, as well as a possible nonequilibrium of the various degrees of freedom present in the molecular system are not taken into account. It shows, however, that we expect considerable heating of the grain by the ion track.
Our simulation volume is a cuboid that dynamically grows to include all atoms. In order to allow for efficient parallelization, all particles (i.e. molecular clusters, isolated molecules and atoms) that reach a certain boundary (here: a sphere of 120 Å radius) are not followed further in the simulation, but their positions and their final velocities, as well as their assignment to molecular clusters, are recorded for further evaluation. Thus, we constrain the simulation volume and allow a reasonable assignment of processors to simulation subvolumes. Atoms that reach the boundary are not followed further in the simulation, but their positions and their final velocities, as well as their assignment to molecular clusters, are recorded for further evaluation.
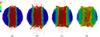 |
Fig. 2 Meridional cut through the irradiated grain at times of a) 1.6 ps, b) 6.4 ps, c) 19.2 ps, d) 49.4 ps after track formation. Color denotes the local temperature. Figure prepared with OVITO (Stukowski 2010). |
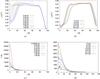 |
Fig. 3 Dependence of the density (a), b)) and the temperature (c), d)) at various times after track formation on the distance, r, to the track axis. The data were obtained by averaging in azimuthal and axial direction over all atoms in a central slice of height 60 Å in the grain. |
2.3. Detection algorithms
We use several detector algorithms to identify important quantities of our simulation. They are described in the following.
Local temperatures are evaluated for each atom as the local average of the kinetic energy in a sphere with radius of rc = 8.51 Å, containing roughly 180 atoms; in order to subtract the directed energy of motion, the kinetic energies are evaluated in the center-of-mass system of the sphere. Similarly local densities are determined as the average around each atom in a sphere with radius of rc (Colla & Urbassek 1997). We note that the concept of “local temperature” is often used in MD simulation, but may be open to some doubt due to the small atomic ensembles used, and also because of the question whether these ensembles are thermally equilibrated. However, the local temperature may be considered as representing the average local kinetic energy density.
Ejection from the grain is identified by using Stoddard’s (1978) cluster detector. It identifies all atoms that belong to the same cluster by using a distance criterion, 10 Å. This scheme allows for an efficient dynamic grouping of the atoms in the simulation volume into clusters. The largest cluster is identified as the grain; the other groups are either isolated atoms, molecules, or molecular clusters, and all contribute to the ejection yield.
The cluster detector by Stoddard (1978) is also used to identify molecules from its atomic constituents. It uses a distance criterion to identify all atoms belonging to the same molecule. Then a smaller distance d is used as the distance criterion. We use d to denote the maximum distance between two atoms such that they are assigned to the same molecule. In view of the fact that molecules may be vibrationally excited the distance must be chosen larger than the equilibrium bond length. We chose a value of d = 1.7 Å for C, N, and O atoms; while for H we adopted 1.3 Å (Mücksch et al. 2014). This scheme allows for an efficient dynamic grouping of all atoms in the irradiated target into molecules. We have used it previously in several instances (Anders & Urbassek 2007, 2009, 2013; Anders et al. 2013; Mücksch et al. 2014).
3. Results
3.1. Time evolution of density and temperature
Figure 2 visualizes the fate of the grain after track formation in the form of snapshots at selected times. The points where the track penetrates the grain surfaces lead to abundant ejection. While the equatorial surfaces of the track remain cold until the very last snapshot displayed, the radius of the heated zone around the track axis broadens with time as a result of heat conduction. Emission has slowed down in the last snapshot, and the ion track has become considerably depopulated.
Because of the sudden formation of the ion track, a pressure wave passes through the grain. Its characteristics are plotted in Fig. 3, where density and temperature profiles are shown as a function of radial distance r to the track axis. The data apply to a 60 Å high equatorial slice, and have been averaged in azimuthal direction and over the height of the slice.
Within 0.5 ps the density in the center of the track decreases to 25% of the original value. The material has moved sideways and the motion of a compression peak towards the grain surface is seen. The height of the compressive peak decreases with time and its amplitude broadens. When the compression wave reaches the surface – at around 3.2 ps – the surface bulges out. At later times, the outer surface undergoes radial oscillations. In the meantime, the center of the track has become more or less completely emptied of material; but material starts to move in from the sides and may close the track again on time scales large compared to our simulation time.
The temperatures reach exorbitantly high values immediately after track formation. These temperatures express the high energy densities present in the track core. After around 1 ps, the temperature drops below 5000 K. These high temperatures are considerably above the critical temperatures of all species considered in this work, see Table 1; this fact explains the high molecular emission observed in the snapshots of Fig. 2. At later times, the temperature in the track center continuously decreases; but even at the end of the simulation, it has values of around 500 K, sufficient to drive abundant evaporation at least for the species with the smallest critical temperature, CO2.
Heat is transported out of the central track region both by diffusion and by the compression wave discussed above. Beyond a radius of around 30 Å from the track center, the temperatures are only slowly increasing and are below 300 K even at the end of the simulation. As the final snapshot of Fig. 2 shows, the surface temperatures around the equator remain cold and do not influence emission.
3.2. Ejection
In Fig. 2 we have already shown that the ion track induces abundant ejection. In total, 3573 atoms in 1278 molecules are ejected. The early ejection is caused by the intense energy deposition in the track itself and may be termed (prompt) “sputtering”; it is due to the high pressure building up in the track, which drives material not only sideways, see Fig. 3, but also in axial direction out of the track region. The emission at later times is not driven by pressure, but is due to the high temperatures prevailing in the track center, and also in the surrounding regions, see Fig. 3. It may hence be termed “evaporation”.
We can follow molecule emission by monitoring the number of initial molecules that have been lost from the grain, Fig. 4a. Note that molecules can disappear from the grain also by chemically transforming to other species. We therefore also provide Fig. 4b which gives the number of molecules lost solely due to reactions.
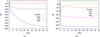 |
Fig. 4 Temporal evolution of the change in the number of molecules that originally constituted the grain. a) Total number of molecules lost from the grain, either by emission or by reaction. b) Number of molecules lost from the grain by reaction. |
Numbers N of ejected molecules of the species originally present in the ice mixture, and their fractions f of the original number.
For all species with the exception of H2O reactions occur quickly, within the first 2 ps after ion track formation. At later times the molecule numbers only slightly change, with a decreasing tendency. Water forms a striking exception by showing a non-monotonous behavior. Beyond 2 ps, the number of water molecules increases again, as a result of recombination processes. We think that this peculiar behavior is caused for two reasons: (i) H+ as the dissociation product of water is highly mobile, and can quickly find its recombination partners; (ii) since H2O is the majority species in the ice mixture, the probability of finding the suitable recombination partners is high.
The total number of molecules lost from the grain, Fig. 4a, follows well the number of reactions monitored in Fig. 4b. For water, however, we see a decrease setting in after around 5 ps, which counteracts molecule restoration by recombination. This decrease is caused by the long-term continuous molecule evaporation. Evaporation is also seen for NH3, but less for methanol. It is particularly pronounced for CO2, which features the highest loss rate from the grain.
The total number of original molecules ejected is given in Table 2. These numbers are correlated with the (inverse of the) critical temperatures of these species, see Table 1. CO2 with the smallest critical temperature of 304 K features the highest ejection yield, followed by NH3 and CH3OH in the inverse sequence of their critical temperatures. Water is again an exception; despite the high critical (and also triple-point) temperature, emission is substantial, and occurs over a large period of time, see Fig. 4a. Again, we correlate this behavior with the high recombination propensity of H+. Since recombination generates heat, it locally heats the grain enabling the water molecules to be ejected. The correlation between the termination of recombination reactions – at 10 ps, see Fig. 4b – and of water ejection at roughly the same time – see Fig. 4a – corroborates this argument. We note that the enthalpies of mixing in the ice mixture may also play a role in determining which species is most easily emitted. In particular, since water is the dominant species, hydration energies may influence emission, as hydrated species need to break their hydration bonds before emission; otherwise they may be emitted as part of a hydrated cluster, see the discussion in Sect. 3.4 below.
We conclude that grain heating by the track can be decisive for the losses if the final grain temperature is in the range of the critical temperatures.
In summary, Fig. 4 demonstrates that our simulation time is sufficient to model the chemical transformations in the molecular species, and also the prompt sputtering processes, but not necessarily the evaporation processes. Since the temperature in the grain, heated by the ion track, is high compared to the triple point temperatures of the species, Table 1, evaporation will continue on long time scales until evaporation cooling will stop evaporation. The grain temperature at the end of the simulation amounts to 168 K.
3.3. Energy and angle distributions
We summarize important characteristics of the ejection process in Fig. 5. These data are for particles that have reached at least a distance of 120 Å from the grain center. The data are taken at the end of the simulation, such that further changes in the data may be assumed to be small. Such changes may be affected by various processes: further ongoing evaporation; collisions among the ejecta; or break-up of emitted clusters.
Figure 5a displays the distribution f(E) of the kinetic energy of the ejected particles, E. To be precise, E denotes the translational center-of-mass energy of all ejected molecules (or isolated atoms) and f(E)dE equals the (normalized) number of molecules with energy in the interval [ E,E + dE ]. The distribution has a maximum in the range of E = 0.075–0.10 eV. The distribution can be fit by a Maxwellian,  (2)where C is a constant, k is Boltzmann’s constant, and Tfit is a fit temperature. As shown in Fig. 5a, a fit with Tfit = 1093 K represents the data quite satisfactorily in the energy range of E ≤ 0.5 eV; a number of particles are emitted with higher energies and are not represented well by the Maxwellian fit function. Fits to Maxwellian distributions have been attempted already previously when describing data of emission from ion impact on condensed-gas targets (Haring et al. 1984). We note that if we detect the energy distribution at an earlier time, 21 ps, see Fig. 5c, we obtain a slightly hotter distribution, with a maximum in the range of E = 0.125–0.15 eV and a fit temperature of Tfit = 1946 K; note that the Maxwellian fit works for a wider energy range – up to 1.5 eV – than for the later time. The apparent cooling of the distribution results from the late emission of CO2 molecules with a low temperature whose contribution decreases the average temperature of the entire ejected ensemble.
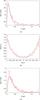 |
Fig. 5 Distribution of a) energy and b) ejection angle of particles emitted from the grain. Data evaluated at the end of the simulation, 49.3 ps after ion-track formation. The curve in a) denotes a Maxwellian distribution, Eq. (2), with temperature Tfit = 1093 K fit to the data. The curve in b) represents a fit of the simulation data to Eq. (3) and describes the jet-like emission along the jet axis, ϑ = 0° and ϑ = 180°. c) shows the energy distribution at an earlier time, 21 ps; here the fit was performed with Tfit = 1946 K. |
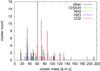 |
Fig. 6 Number of clusters – containing at least two molecules – found in the ejecta at the end of the simulation. The colors denote the molecules contained in the clusters. |
The temperature in this fit, Eq. (2), should not be assigned an immediate physical relevance; rather it denotes an average temperature. Since emission occurs over a long time, and the temperature in the emission region is constantly decreasing, the emission distribution might be thought of being composed of a series of (weighted) Maxwellians. Still, the relatively high temperature Tfit – consistent with the high energy of the most probable emission events – indicates the importance of early emission events, where the central track temperature is still high.
Analogously, we display in Fig. 5b the angular distribution of emitted molecules. Let ϑ denote the emission angle of the center-of-mass velocity of an ejected particle measured with respect to the track axis; positive angles denote the upper, and negative angles the bottom hemisphere. f(cosϑ)dcosϑ equals the (normalized) number of particles with cosine of the emission angle in the interval [ cosϑ,cos(ϑ + dϑ) ]. We note that an isotropic emission from the surface of the grain corresponds to a constant function, f(cosϑ) = const. Our data, Fig. 5b, show that emission is far from isotropic; it is rather concentrated on emission along the angles ϑ = 0° and 180°; that is, along the track axis. The difference in emission in the upper and lower hemispheres are due to thermal fluctuations in the emission process.
We can fit the angular distribution with an overcosine distribution,  (3)The constant term, a corresponds to isotropic emission, to evaporation from throughout the grain surface, while the second term models a jet component. We can provide a satisfactory fit with a = 0.12, b = 1.4, and γ = 2.65. The ratio of the integrals under the two contributions to Eq. (3), [ b/ (γ + 1) ] :a = 3.2, shows that the jet component is dominant in the emission distribution. Such peaked distributions have been found previously for emission from ion tracks, both in simulations (Urbassek et al. 1994) and in experiments (Toulemonde et al. 2002), and have been interpreted as being due to an emission jet along the ion track axis, such as found here.
3.4. Cluster emission
The data assembled in Table 2 also compares the ejection yield of isolated molecules with that bound in larger molecular clusters. We see that NH3 and CH3OH are often emitted as parts of a larger cluster, while H2O – and even more so CO2 – are ejected as single molecules. This partitioning is clearly connected to the importance of the evaporation contribution to the total emission yield. CO2 and also H2O show a high fraction of evaporation contributing to the emission, see Fig. 4a; since evaporation occurs via single molecules, it increases the single-molecule contribution to the ejection yield. NH3 and CH3OH, on the other side, feature no evaporation, due to their high critical temperatures. In consequence, their single-molecule contribution is suppressed.
This analysis implies that early emission occurs with a large percentage through molecular clusters. Such a feature is well known for sputtering under high-energy density conditions, the so-called spikes, that occur under heavy ion and in particular cluster ion impacts (Colla et al. 2000; Kissel & Urbassek 2001; Urbassek 2008; Sandoval & Urbassek 2015).
Figure 6 displays an overview over the molecular clusters emitted from the grain up to the end of the simulation. All clusters in which at least two molecules are combined are included. In an attempt to identify the molecular content, different colors are used for the different molecular species. Quantitatively, we find that the astonishingly high fraction of 35% of the molecules contained in clusters are fragments and product molecules. Accordingly the fractions of original molecules are reduced to 31% for CO2, 26% for H2O, and only 7% for NH3, and 1.2% for CH3OH. Thus, CO2 has become the majority component, evidently due to the intense CO2 evaporation occurring throughout the simulation. NH3, and in particular CH3OH are depleted in the clusters, since they leave the grain preferentially in the form of fragments rather than as intact molecules.
In detail, we find 127 molecular dimers, 22 trimers, and nine quadrumers. The largest clusters found by us, containing five or more molecules, have the composition:
-
(H2O)4(CO2)2(NH3)2(OH),
-
(H2O)6(CO2)2(NH3),
-
(H2O)4(CO2)2(NH2)(NH4),
-
(H2O)4(CO2)(NH3)(NH4),
-
(H2O)4(CO2)(NH3), and
-
(H2O)4H.
So these largest clusters feature a prominent contribution of H2O, more than the average values reported above. We argue that this is caused by the large hydration binding energy that H2O binds to other molecules.
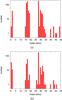 |
Fig. 7 Number of chemically transformed species (fragments and product molecules) found in a) the grain and b) the ejecta at the end of the simulation. |
3.5. Chemical transformations
We assemble the species found in the grain at the end of the simulation in Fig. 7a in a form analogous to mass spectra. The original molecular species have been omitted in the plot. The figures demonstrates that a rich variety of fragment and product molecules have been formed, ranging in intensity from one molecule to more than a hundred. The most abundant species are NH2 (mass 16 amu), OH (17 amu) and CO (28 amu). Similarly, Fig. 7b displays the species found in the ejecta, again by omitting the original molecules whose emission characteristics are assembled in Table 2. Again OH and CO are prominent, while NH2 is somewhat decreased. Table 3 provides all species which were produced with at least three specimens.
Transformed molecular species found at the end of the simulation in the grain and in the ejecta.
Let us first discuss the fragments and products evidently deriving from water. While OH is abundant, only very few (three) isolated H atoms are found; this is due to the high reactivity of H in the irradiated ice mixture. H2 is found to a higher percentage, and so are O2 and H3O. H2O2 is found only rarely, and no O3 was detected.
In the ejecta, isolated H is relatively frequent and even more abundant than H2. This is due to the fact that during the early hot sputtering phase, dissociation products such as H (and also OH) are emitted and then find no collision partners to recombine or react with. Similarly, single O atoms are found frequently in the ejecta, but also reacted O2.
Similarly, NH3 fragments – in particular NH2, but also a few NH – are found both in the grain and in the ejecta. However, the product NH4 is found enriched in the grain, but only rarely in the ejecta. Further frequent reaction products are NO, both in the grain and in the ejecta, and HNO, which is enriched in the ejecta, since it is highly reactive and all but one HNO species in the grain have reacted.
Furthermore, carbon containing molecules are found. Here CO is the major fragment, both in the grain and in the ejecta. But, interestingly, the second in abundance is formaldehyde (H2CO), which derives from the dissociation of methanol. Also the methanol fragment CH2OH – and the methoxy group H3CO, which we can differentiate by inspection of its molecular geometry – are abundantly produced.
We conclude that fragments are found enriched in the ejecta, while product molecules tend to form – and remain – in the irradiated grain.
Since the simulation keeps track of the identity of atoms, we can follow the chemical reactions in detail. We describe a few interesting results below:
-
O2 is formed mostly from CO2 fragmentation (46 out of 76 O atoms); the next largest source is H2O (27 O atoms);
-
H2 originates mostly from all the H-containing species, in the order of H2O (59 out of 96 H atoms), NH3 (29) and CH3OH (8);
-
the 37 formaldehyde (H2CO) molecules produced take their C and O atoms mostly from methanol (33 C and 27 O); the remainder of the C atoms stem from CO2 and the remainder of the O atoms originate from H2O and CO2;
-
by far the most recombinations leading to the same product molecule occur in H2O, where 1304 recombination reactions were monitored; the next species is NH3, where only 36 recombinations occur.
-
The processes occurring in a frozen methanol target after impact of energetic particles using laboratory astrophysics techniques are studied by de Barros et al. (2011b). They find that the induced CH3OH dissociation gives rise to the formation of molecular species, particularly H2CO and CH4, but also CH2OH, CO, CO2, HCO and HCOOCH3. In their Fig. 7, they propose a pathway for the methanol dissociation and the successive chemical reactions. OH abstraction generates CH3, and by H+ addition: CH4. On the other hand, consecutive H abstraction generates H2CO and eventually CO, from which O addition leads to CO2. The abundant formation of formaldehyde and of CH2OH parallels our results; however, we find only little methane (two molecules). CO is formed in our simulation probably more as a CO2 fragment than by multiple-step reactions from methanol.
-
Ammonia ice is studied by Bordalo et al. (2013). They find new species: hydrazine (N2H4), diazene (N2H2), molecular hydrogen (H2), and nitrogen (N2). In water-ammonia ice mixtures they identify additionally nitrous oxide (N2O), nitrogen oxide (NO), nitrogen dioxide (NO2), and hydroxylamine (NH2OH). They find that ammonia destruction is enhanced in the presence of H2O in the ice. These studies are extended by Pilling et al. (2010a) to mixtures of water ices with ammonia and/or CO. Among the novel species, they find HNCO, N2O, OCN−, and NH
 . While H2 is amply formed in our
simulations – but may also derive from methanol fragments – we observe no
N2 or any
other of the molecular products involving two N atoms. Indeed, we checked whether
free N atoms were produced at some step in the simulation, but found none; this
explains why no N2 is created. However, the reactions with O are also
seen in our simulations, as we observe NO abundantly, and also (rarely)
NO2.
Interestingly, also NH2OH is found in our simulations, albeit more
abundantly in the ejecta. NH is a product commonly seen in our simulation.
. While H2 is amply formed in our
simulations – but may also derive from methanol fragments – we observe no
N2 or any
other of the molecular products involving two N atoms. Indeed, we checked whether
free N atoms were produced at some step in the simulation, but found none; this
explains why no N2 is created. However, the reactions with O are also
seen in our simulations, as we observe NO abundantly, and also (rarely)
NO2.
Interestingly, also NH2OH is found in our simulations, albeit more
abundantly in the ejecta. NH is a product commonly seen in our simulation.
-
Ice mixtures of H2O:CO2 were studied by Pilling et al. (2010b). They find as major products CO, H2O2, and to a lesser extent O3, H2CO3 and CO3. We find CO as the most abundant fragment in our simulations, and also H2O2, but only in small amounts. However, no O additions leading to molecules with three O are observed. However, we observe a few molecules containing two C atoms, among which are C2O, C2O2, and (COH)2.
-
The molecules found in our study parallel many of those found in experiment. While this appears trivial for the fragments identified, it is reassuring for the true product molecules encountered.
-
However, we do not observe N2 or any molecules containing two N atoms. While we do observe O2 – mainly as a dissociation product of CO2 – we do not observe O3 or any other molecules containing three O atoms. However, we observe molecules containing two C atoms, which must be true reaction products. We surmise that this lack of reaction products is caused by the small density of radicals formed and the short time available to molecules for reacting. In experiments, larger radical densities may build up since for the ion fluences used – up to 2 × 1013 cm-2 in Pilling et al. (2010a) – several ion tracks may overlay each other.
-
When searching for possible interesting and astrophysically relevant organic molecules containing both C and O, possibly repeated impacts into a grain should be simulated. We note, however, that comparable laboratory experiments only found traces of such molecules. In a methanol: ammonia ice mixture, Caro et al. (2014) identify a variety of organic species caused by energetic impacts, containing both C and N; as an example, they find urea NH2CONH2 (an amide). However, many of the compounds are only formed during warm-up of the ice. This paper discusses the probable reaction pathways leading to these products.
3.6. Changed ion-track radius
While the total energy deposition – or stopping power – of a cosmic ray ion of known energy can be predicted quite accurately, the exact modeling of the radial energy deposition profile is open to some arbitrariness. In order to obtain some information about the effects of the radial energy deposition profile, we performed a second simulation (simulation 2) where we doubled the track radius, 10 Å, but kept an identical energy deposition.
In simulation 2, with increased track radius, the initial temperatures reached in the track are smaller than in the standard simulation, while the final temperatures reached after equilibration of the grain is the same via Eq. (1). Here we observe similar chemical transformations as in our standard simulation: in fact, as Table 3 shows, the identical species are produced as in the standard simulation, with only very few exceptions. This feature corroborates our chemical analysis and shows that the chemical reactions proceeding after ion track formation are reproducible in the simulation. In the species that are produced only rarely – less than three molecules – some fluctuations exist between the two simulations. The total number of chemically transformed species amounts to 1099 molecules in the simulation 2 as compared to 1122 in the standard simulation. Of these, 385 (445) are emitted, while 714 (667) are retained in the grain in simulation 2 (standard simulation). We conclude that for the amount of chemical transformations, it is mainly the total deposited energy that counts and to a lesser extent the maximum temperatures achieved in the track.
However, the total number of original species emitted is increased in simulation 2 for all species, except NH3, see Table 2. Also the total ejection yield has risen from 3573 atoms in the standard simulation to 4314 atoms. This happens because prompt sputtering, and to a greater extent long-term evaporation, is effective over a larger area, thus increasing the total ejection flux. We note that the gas-flow model of condensed-gas sputtering (Urbassek & Michl 1987), which describes atom emission from a region that has been energized above the critical temperature, predicts only a slight dependence of the yield on the track temperature, while below the phase transition temperature, the Arrhenius law (exp−(U/kT)) introduces a strong dependence.
The overall reduced temperature in simulation 2 leads to a slight reduction in the effective temperature of ejecta, which amounts to only 989 K compared to 1093 K in simulation 1. More pronounced is the reduction in the maximum kinetic energy of the ejecta from 16.3 eV (simulation 1) to 6.7 eV (simulation 2). Also the degree of clustering in the emission process has been increased, and we now find 147 molecular dimers, 23 trimers and 10 quadrumers. In these the proportion of H2O and CO2 has risen by 41% and 24%, respectively, as compared to simulation 1. The largest clusters (five or more molecules) found are
-
(H2O)24(CO2)5(NH3)7(CH3OH)(OH)2(NH2)(CH3O),
-
(H2O)14(CO2)4(NH3)2(CH3OH)(NH2)2,
-
(H2O)(CO2)2(OH)2(CO)2(NH),
-
(H2O)2(CO2)2(NH3)(NO),
-
(CO2)3(NH3)(H3O).
Here in particular the largest clusters contain H2O over-proportionally.
In summary, a doubled track radius – at identical total energy deposition – reduces the central temperature by a factor of around four. Changes in the chemical transformations and in the properties of ejecta are small, in the order of 10–20%. Most pronounced is an increase in the fraction of clustered ejecta.
4. Summary
We present a MD simulation study of the consequences of the impact of a cosmic ray ion into an astrophysical ice grain. The use of a REAX potential, which allows the breaking and forming of chemical bonds, permits us to study not only the mechanical and thermal effects of the irradiation but also the chemical transformation of the molecules present in the original ice mixture. We focus on the case of an energy deposition of 1 keV/nm into a H2O:CO2:NH3:CH3OH mixture.
The heated track emits a shock wave into the surrounding grain. While the temperatures in the track are initially exceedingly high, they quickly drop as the shock wave penetrates the grain. Upon reflection from the grain boundaries, the wave excites radial oscillations of the entire grain.
As a consequence of the strong energy deposition, abundant molecule fragmentation is observed. We find CO, OH, and NH2 as the most abundant fragments.
The fragments are found to undergo subsequent chemical reactions. These are partly recombination reactions, restoring the original molecules. However, new products are also formed. The most abundant product molecules are formaldehyde (H2CO), NH4, H2, H3O, and O2.
The ion track abundantly sputters matter from the grain; at later times also strong evaporation adds to the mass loss from the grain. The ejecta are composed of both original and chemically transformed molecules. Besides isolated atoms and molecules, molecular clusters are emitted.
The number of all original molecules continuously decreases after the impact. However, H2O forms an exception as the number of molecules recovers again after a few ps. This is caused by the particularly strong tendency of OH− and H+ to recombine again after dissociation, and is caused by the strongly polar nature of water.
The energy distribution of the ejecta is characterized by a Maxwellian energy distribution with temperature of around 1100 K. Its angular characteristics are governed by a jet-like structure aligned with the ion-track axis.
Fragments are found enriched in the ejecta, while product molecules tend to form – and remain – in the irradiated grain.
For the number of chemical transformations, it is mainly the total deposited energy that counts and less the maximum temperatures achieved in the track. For the emission yields, however, grain heating by the track can be decisive for the losses if the final grain temperature is in the range of the critical temperatures.
Acknowledgments
We acknowledge financial support by the Deutsche Forschungsgemeinschaft within project Ur 32/27-1. Simulations were performed at the High Performance Cluster Elwetritsch (RHRK, TU Kaiserslautern, Germany).
References
- Allodi, M. A., Baragiola, R. A., Baratta, G. A., et al. 2013, Space Sci. Rev., 180, 101 [NASA ADS] [CrossRef] [Google Scholar]
- Anders, C., & Urbassek, H. M. 2007, Phys. Rev. Lett., 99, 027602 [NASA ADS] [CrossRef] [Google Scholar]
- Anders, C., & Urbassek, H. M. 2009, Nucl. Instrum. Meth. B, 267, 3227 [NASA ADS] [CrossRef] [Google Scholar]
- Anders, C., & Urbassek, H. M. 2010, J. Phys. Chem. C, 114, 5499 [CrossRef] [Google Scholar]
- Anders, C., & Urbassek, H. M. 2013, Nucl. Instrum. Meth. B, 303, 200 [Google Scholar]
- Anders, C., Pedrys, R., & Urbassek, H. M. 2013, Nucl. Instrum. Meth. B, 315, 308 [NASA ADS] [CrossRef] [Google Scholar]
- Balaji, V., David, D. E., Tian, R., Michl, J., & Urbassek, H. M. 1995, J. Phys. Chem., 99, 15565 [CrossRef] [Google Scholar]
- Baragiola, R. A., Fama, M. A., Loeffler, M. J., et al. 2013, in The Science of Solar System Ices, eds. M. S. Gudipati, & J. Castillo-Rogez (New York: Springer), Astrophys. Space Sci. Lib., 356, 527 [Google Scholar]
- Beuve, M., Stolterfoht, N., Toulemonde, M., Trautmann, C., & Urbassek, H. M. 2003, Phys. Rev. B, 68, 125423 [NASA ADS] [CrossRef] [Google Scholar]
- Bordalo, V., da Silveira, E. F., Lv, X. Y., et al. 2013, ApJ, 774, 105 [NASA ADS] [CrossRef] [Google Scholar]
- Bottinelli, S., Boogert, A. C. A., Bouwman, J., et al. 2010, ApJ, 718, 1100 [NASA ADS] [CrossRef] [Google Scholar]
- Bringa, E. M., & Johnson, R. E. 2002, Nucl. Instrum. Meth. B, 193, 365 [Google Scholar]
- Bringa, E. M., & Johnson, R. E. 2004, ApJ, 603, 159 [NASA ADS] [CrossRef] [Google Scholar]
- Bringa, E. M., Kucheyev, S. O., Loeffler, M. J., et al. 2007, ApJ, 662, 372 [NASA ADS] [CrossRef] [Google Scholar]
- Caro, G. M. M., Dartois, E., Boduch, P., et al. 2014, A&A, 566, A93 [NASA ADS] [CrossRef] [EDP Sciences] [Google Scholar]
- Chenoweth, K., van Duin, A. C. T., & Goddard III, W. A. 2008, J. Phys. Chem. A, 112, 1040 [CrossRef] [PubMed] [Google Scholar]
- Cherednikov, Y., Sun, S. N., & Urbassek, H. M. 2013, Phys. Rev. B, 87, 245424 [NASA ADS] [CrossRef] [Google Scholar]
- Colla, T. J., & Urbassek, H. M. 1997, Radiat. Eff. Defects Solids, 142, 439 [NASA ADS] [CrossRef] [Google Scholar]
- Colla, T. J., Aderjan, R., Kissel, R., & Urbassek, H. M. 2000, Phys. Rev. B, 62, 8487 [NASA ADS] [CrossRef] [Google Scholar]
- David, D. E., & Michl, J. 1989, Prog. Solid St. Chem., 19, 283 [NASA ADS] [CrossRef] [Google Scholar]
- de Barros, A. L. F., Bordalo, V., Duarte, E. S., et al. 2011a, A&A, 531, A160 [NASA ADS] [CrossRef] [EDP Sciences] [Google Scholar]
- de Barros, A. L. F., Domaracka, A., Andrade, D. P. P., et al. 2011b, MNRAS, 418, 1363 [NASA ADS] [CrossRef] [Google Scholar]
- Draine, B. T. 2003, ARA&A, 41, 241 [NASA ADS] [CrossRef] [Google Scholar]
- Fenyö, D., Sundqvist, B. U. R., Karlsson, B. R., & Johnson, R. E. 1990, Phys. Rev. B, 42, 1895 [NASA ADS] [CrossRef] [Google Scholar]
- Fleischer, R. L., Price, P. B., & Walker, R. M. 1975, Nuclear Tracks in Solids (Berkeley: University of California) [Google Scholar]
- Gudipati, M. S., & Castillo-Rogez, J. 2013, The Science of Solar System Ices (New York: Springer), Astrophys. Space Sci. Lib., 356 [Google Scholar]
- Haring, R. A., Pedrys, R., Haring, A., & de Vries, A. E. 1984, Nucl. Instrum. Meth. B, 4, 40, erratum B6 (1985), 585 [NASA ADS] [CrossRef] [Google Scholar]
- Johnson, R. E. 1990, Energetic Charged-Particle Interactions with Atmospheres and Surfaces (Berlin: Springer) [Google Scholar]
- Johnson, R. E., & Liu, M. 1996, J. Chem. Phys., 104, 6041 [NASA ADS] [CrossRef] [Google Scholar]
- Johnson, R. E., Carlson, R. W., Cassidy, T. A., & Fama, M. 2013, in The Science of Solar System Ices, eds. M. S. Gudipati, & J. Castillo-Rogez (New York: Springer), Astrophys. Space Sci. Lib., 356, 551 [Google Scholar]
- Kafemann, H., & Urbassek, H. M. 1993, Mod. Phys. Lett. B, 7, 857 [NASA ADS] [CrossRef] [Google Scholar]
- Kissel, R., & Urbassek, H. M. 2001, Nucl. Instrum. Meth. B, 180, 293 [NASA ADS] [CrossRef] [Google Scholar]
- Liu, L., Liu, Y., Zybin, S. V., Sun, H., & Goddard, III, W. A. 2011, J. Phys. Chem. A, 115, 11016 [CrossRef] [Google Scholar]
- Martínez, L., Andrade, R., Birgin, E. G., & Martínez, J. M. 2009, J. Comp. Chem., 30, 2157 [CrossRef] [PubMed] [Google Scholar]
- Martins, Z., Price, M. C., Goldman, N., Sephton, M. A., & Burchell, M. J. 2013, Nature Geosc., 6, 1045 [Google Scholar]
- Monti, S., van Duin, A. C. T., Kim, S.-Y., & Barone, V. 2012, J. Phys. Chem. C, 116, 5141 [CrossRef] [Google Scholar]
- Mookerjee, S., Beuve, M., Khan, S. A., Toulemonde, M., & Roy, A. 2008, Phys. Rev. B, 78, 045435 [NASA ADS] [CrossRef] [Google Scholar]
- Mücksch, C., Anders, C., Gnaser, H., & Urbassek, H. M. 2014, J. Phys. Chem. C, 118, 7962 [CrossRef] [Google Scholar]
- Pilling, S., Duarte, E. S., da Silveira, E. F., et al. 2010a, A&A, 509, A87 [NASA ADS] [CrossRef] [EDP Sciences] [Google Scholar]
- Pilling, S., Duarte, E. S., Domaracka, A., et al. 2010b, A&A, 523, A77 [NASA ADS] [CrossRef] [EDP Sciences] [Google Scholar]
- Plimpton, S. 1995, J. Comput. Phys., 117, 1, http://lammps.sandia.gov/ [Google Scholar]
- Sandoval, L., & Urbassek, H. M. 2015, Nanoscale Res. Lett., 10, 314 [NASA ADS] [CrossRef] [Google Scholar]
- Shen, C. J., Greenberg, J. M., Schutte, W. A., & van Dishoeck, E. F. 2004, A&A, 415, 203 [NASA ADS] [CrossRef] [EDP Sciences] [Google Scholar]
- Stoddard, S. D. 1978, J. Comput. Phys., 27, 291 [NASA ADS] [CrossRef] [Google Scholar]
- Stukowski, A. 2010, Model. Simul. Mater. Sci. Eng., 18, 015012, http://www.ovito.org/ [Google Scholar]
- Toulemonde, M., Assmann, W., Trautmann, C., & Grüner, F. 2002, Phys. Rev. Lett., 88, 057602 [NASA ADS] [CrossRef] [PubMed] [Google Scholar]
- Toulemonde, M., Assmann, W., Dufour, C., et al. 2006, in Ion beam science: Solved and unsolved problems, ed. P. Sigmund (Copenhagen: Royal Danish Academy of Sciences), Mat. Fys. Medd. Dan. Vid. Selsk., 52, 263 [Google Scholar]
- Urbassek, H. M. 2008, in Handbook of surface science, ed. E. Hasselbrink & B. I. Lundqvist, Dynamics (Amsterdam: Elsevier), 3, 871 [Google Scholar]
- Urbassek, H. M., & Michl, J. 1987, Nucl. Instrum. Meth. B, 22, 480 [NASA ADS] [CrossRef] [Google Scholar]
- Urbassek, H. M., Kafemann, H., & Johnson, R. E. 1994, Phys. Rev. B, 49, 786 [NASA ADS] [CrossRef] [Google Scholar]
- van Duin, A. C. T., Dasgupta, S., Lorant, F., & Goddard III, W. A. 2001, J. Phys. Chem. A, 105, 9396 [CrossRef] [Google Scholar]
- Ziegler, J. F. 2004, Nucl. Instrum. Meth. B, 219, 1027, SRIM: http://www.srim.org/ [NASA ADS] [CrossRef] [Google Scholar]
- Ziegler, J. F., Biersack, J. P., & Littmark, U. 1985, The Stopping and Range of Ions in Solids (New York: Pergamon) [Google Scholar]
All Tables
Physico-chemical properties of the molecular species originally present in the ice mixture.
Numbers N of ejected molecules of the species originally present in the ice mixture, and their fractions f of the original number.
Transformed molecular species found at the end of the simulation in the grain and in the ejecta.
All Figures
|
Fig. 1 Snapshot of the irradiated grain at a time of 1.6 ps after track formation. Color denotes the local temperature. Figure prepared with OVITO (Stukowski 2010). |
| In the text | |
|
Fig. 2 Meridional cut through the irradiated grain at times of a) 1.6 ps, b) 6.4 ps, c) 19.2 ps, d) 49.4 ps after track formation. Color denotes the local temperature. Figure prepared with OVITO (Stukowski 2010). |
| In the text | |
|
Fig. 3 Dependence of the density (a), b)) and the temperature (c), d)) at various times after track formation on the distance, r, to the track axis. The data were obtained by averaging in azimuthal and axial direction over all atoms in a central slice of height 60 Å in the grain. |
| In the text | |
|
Fig. 4 Temporal evolution of the change in the number of molecules that originally constituted the grain. a) Total number of molecules lost from the grain, either by emission or by reaction. b) Number of molecules lost from the grain by reaction. |
| In the text | |
|
Fig. 5 Distribution of a) energy and b) ejection angle of particles emitted from the grain. Data evaluated at the end of the simulation, 49.3 ps after ion-track formation. The curve in a) denotes a Maxwellian distribution, Eq. (2), with temperature Tfit = 1093 K fit to the data. The curve in b) represents a fit of the simulation data to Eq. (3) and describes the jet-like emission along the jet axis, ϑ = 0° and ϑ = 180°. c) shows the energy distribution at an earlier time, 21 ps; here the fit was performed with Tfit = 1946 K. |
| In the text | |
|
Fig. 6 Number of clusters – containing at least two molecules – found in the ejecta at the end of the simulation. The colors denote the molecules contained in the clusters. |
| In the text | |
|
Fig. 7 Number of chemically transformed species (fragments and product molecules) found in a) the grain and b) the ejecta at the end of the simulation. |
| In the text | |
Current usage metrics show cumulative count of Article Views (full-text article views including HTML views, PDF and ePub downloads, according to the available data) and Abstracts Views on Vision4Press platform.
Data correspond to usage on the plateform after 2015. The current usage metrics is available 48-96 hours after online publication and is updated daily on week days.
Initial download of the metrics may take a while.