Fig. 5
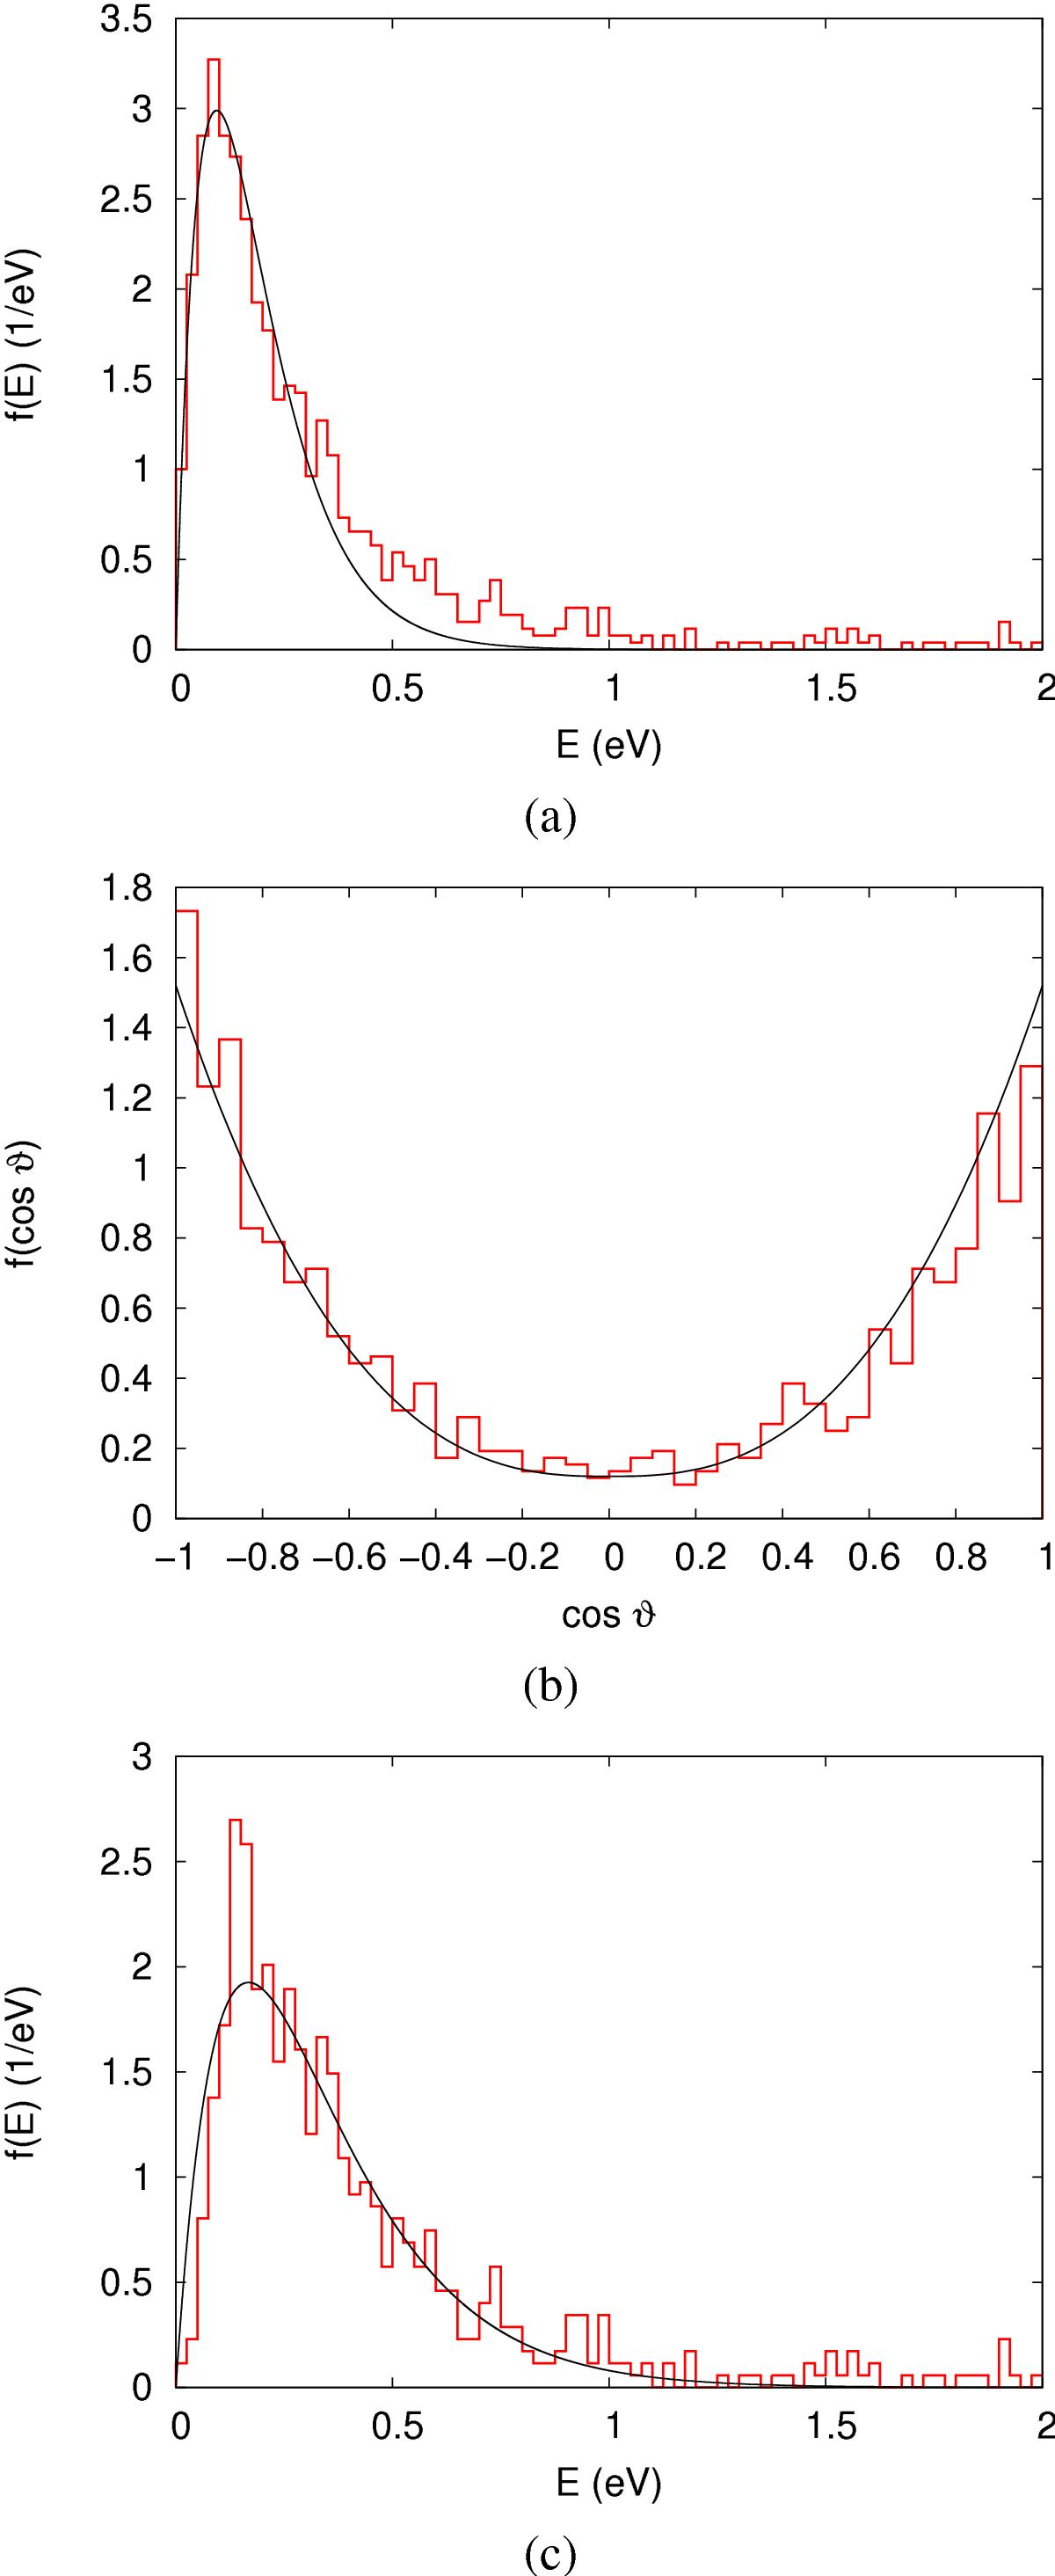
Distribution of a) energy and b) ejection angle of particles emitted from the grain. Data evaluated at the end of the simulation, 49.3 ps after ion-track formation. The curve in a) denotes a Maxwellian distribution, Eq. (2), with temperature Tfit = 1093 K fit to the data. The curve in b) represents a fit of the simulation data to Eq. (3) and describes the jet-like emission along the jet axis, ϑ = 0° and ϑ = 180°. c) shows the energy distribution at an earlier time, 21 ps; here the fit was performed with Tfit = 1946 K.
Current usage metrics show cumulative count of Article Views (full-text article views including HTML views, PDF and ePub downloads, according to the available data) and Abstracts Views on Vision4Press platform.
Data correspond to usage on the plateform after 2015. The current usage metrics is available 48-96 hours after online publication and is updated daily on week days.
Initial download of the metrics may take a while.