Fig. 9
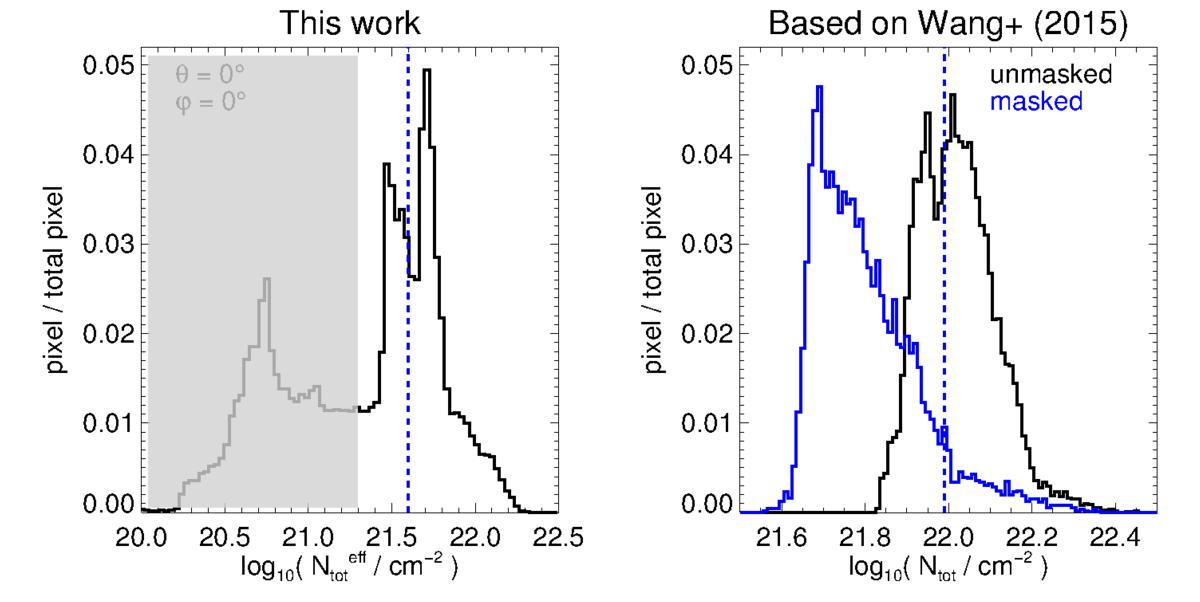
Comparison of (effective) total column density PDFs of Snake based on data of this work (left) and Wang et al. (2015, right. The black lines show the original data of the simulation and observation, respectively. The grey-shaded area on the left plot indicates the range that would be below the detection limit of Herschel. The blue-dotted line in both images indicates the cut limit which is used for noise reduction. The solid blue line in the right plot shows the total column density PDF based on the masked intensity maps.
Current usage metrics show cumulative count of Article Views (full-text article views including HTML views, PDF and ePub downloads, according to the available data) and Abstracts Views on Vision4Press platform.
Data correspond to usage on the plateform after 2015. The current usage metrics is available 48-96 hours after online publication and is updated daily on week days.
Initial download of the metrics may take a while.