Fig. 5
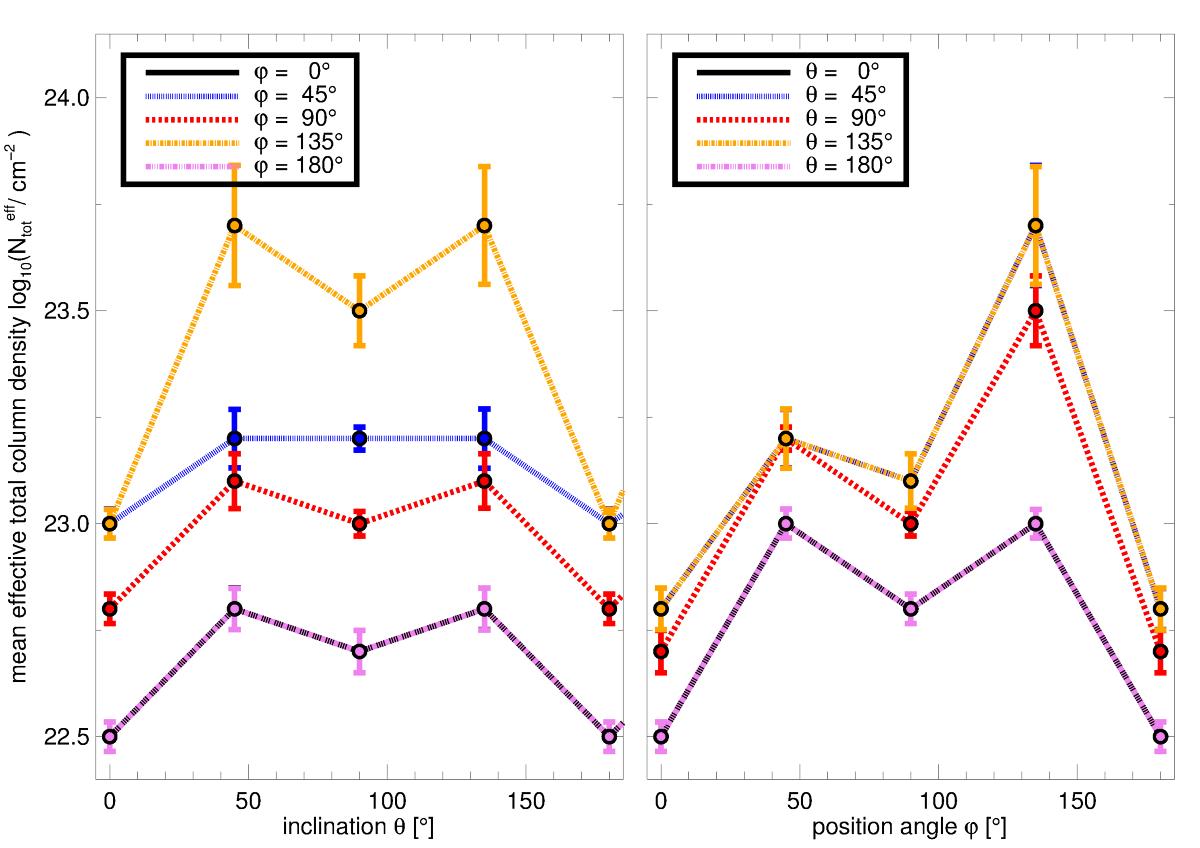
ρ Ophiuchi cloud model. The plots show the mean values of the effective total column density PDFs, ![]() , as a function of the inclination, θ, and position angle, ϕ. The error bars illustrate 1σ errors. Note that we only show the values for inclinations θ ≤ 180° because the values for θ and θ+180° are identical. We see that the mean dust column density strongly depends on the viewing angle. The maximal difference compared to (θ, ϕ) = (0°, 0°) is on the order of 1.7 dex.
, as a function of the inclination, θ, and position angle, ϕ. The error bars illustrate 1σ errors. Note that we only show the values for inclinations θ ≤ 180° because the values for θ and θ+180° are identical. We see that the mean dust column density strongly depends on the viewing angle. The maximal difference compared to (θ, ϕ) = (0°, 0°) is on the order of 1.7 dex.
Current usage metrics show cumulative count of Article Views (full-text article views including HTML views, PDF and ePub downloads, according to the available data) and Abstracts Views on Vision4Press platform.
Data correspond to usage on the plateform after 2015. The current usage metrics is available 48-96 hours after online publication and is updated daily on week days.
Initial download of the metrics may take a while.